
Quantum Computing stock: Negative trend signals and oversold readings drive decline

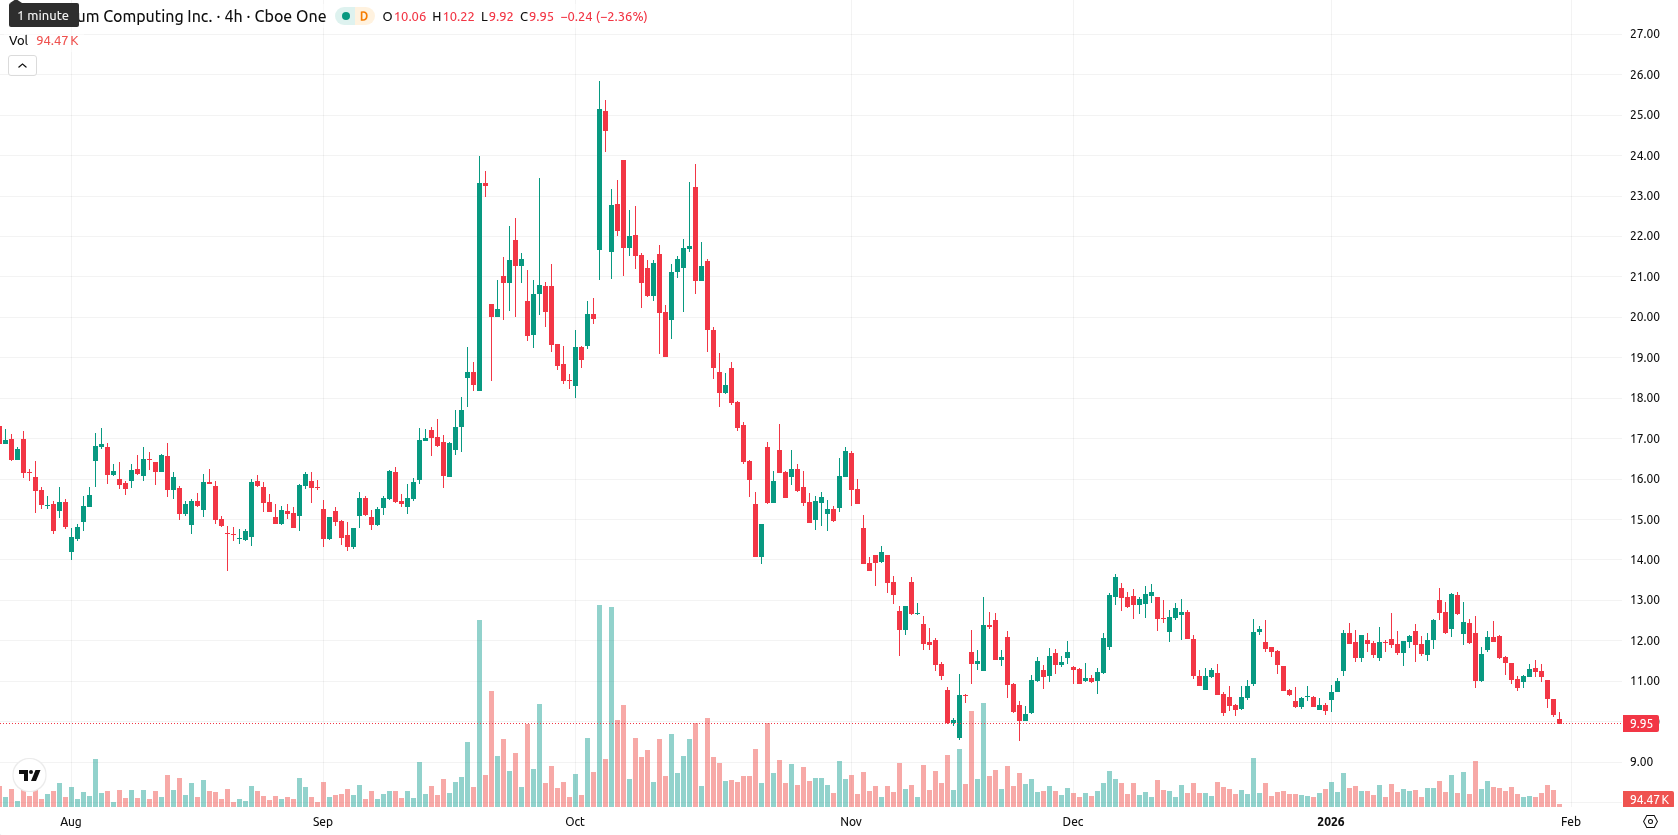
Quantum Computing Inc. (QUBT) is trading at $9.85, reflecting a 3.24% intraday drop from $10.04. The price remains well below the MA-20 ($11.62), MA-50 ($11.59), and MA-200 ($14.25), signaling sustained downside pressure across all key timeframes.
Highlights
- QUBT trades at $9.85, well below the MA-20 ($11.62), MA-50 ($11.59), and MA-200 ($14.25), indicating sustained technical downside pressure across all timeframes.
- Momentum and oscillator signals confirm a strongly bearish, oversold environment, with negative MACD, weak ADX, and both RSI and Stochastic RSI deep in 'Sell' territory.
- The immediate technical range for QUBT is $8.90–$10.80, with key resistance at $11.72 (Ichimoku Kijun); a break below $8.90 could trigger further declines.
Entrenched weakness as technical barriers and momentum deteriorate
Technically, QUBT faces marked overhead resistance, with the Ichimoku Kijun projecting dynamic resistance at $11.72. The asset trades deep beneath all key moving averages, showing entrenched short-, medium-, and long-term weakness. Momentum metrics remain negative, with the daily MACD flashing bearish, ADX pointing to weak trend strength, and both RSI and Stochastic RSI deep in oversold ranges. The Commodity Channel Index, Bull/Bear Power, and Awesome Oscillator all confirm clear seller control and additional downside momentum.
Further declines likely as volatility persists and resistance holds
Looking ahead over the next five trading days, typical volatility situates QUBT within an expected range of $8.90 – $10.80, centered on the current level. The probability of a rebound above $11.72 remains low (under 20%), with momentum signals favoring further declines or choppy sideways movement as selling persists. A bullish breakout would require a sustained move above cluster resistance near $11.72, while a break below $8.90 could accelerate downside as support gives way.
Currently, Quantum Computing Inc. (QUBT) is trading below all major moving averages with persistent downward pressure, lacking immediate support above and facing significant resistance at the Ichimoku Kijun line. Momentum indicators—including MACD, ADX, RSI, Stochastic RSI, and CCI—reflect an oversold environment and continued seller dominance, suggesting ongoing bearish sentiment amid moderate volatility.


Latest Quantum Computing News


-
 Afghanistan
-
 Albania
-
 Algeria
-
 Angola
-
 Argentina
-
 Armenia
-
 Australia
-
 Austria
-
 Azerbaijan
-
 Bahamas
-
 Bahrain
-
 Bangladesh
-
 Belarus
-
 Belgium
-
 Bolivia
-
 Botswana
-
 Brazil
-
 Brunei
-
 Bulgaria
-
 Cambodia
-
 Cameroon
-
 Canada
-
 Chile
Chile
-
 China
China
-
 Colombia
-
 Congo
Congo
-
 Costa Rica
-
 Cote d'Ivoire
-
 Croatia
-
 Cuba
Cuba
-
 Cyprus
-
 Czechia
-
 DR Congo
-
 Denmark
-
 Dominican Republic
-
 Ecuador
-
 Egypt
Egypt
-
 El Salvador
-
 Estonia
-
 Eswatini
-
 Ethiopia
-
 Finland
-
 France
-
 Georgia
-
 Germany
-
 Ghana
Ghana
-
 Greece
-
 Haiti
Haiti
-
 Hong Kong
-
 Hungary
-
 India
India
-
 Indonesia
-
 Iran, Islamic republic
-
 Iraq
Iraq
-
 Ireland
-
 Israel
-
 Italy
Italy
-
 Jamaica
-
 Japan
Japan
-
 Jordan
-
 Kazakhstan
-
 Kenya
Kenya
-
 Korea
Korea
-
 Kuwait
-
 Kyrgyzstan
-
 Laos
Laos
-
 Latvia
-
 Lebanon
-
 Lesotho
-
 Libya
Libya
-
 Lithuania
-
 Luxembourg
-
 Madagascar
-
 Malaysia
-
 Malta
Malta
-
 Mauritius
-
 Mexico
-
 Moldova
-
 Mongolia
-
 Montenegro
-
 Morocco
-
 Mozambique
-
 Myanmar
-
 Namibia
-
 Nepal
Nepal
-
 Netherlands
-
 New Zealand
-
 Nigeria
-
 North Macedonia
-
 Norway
-
 Oman
Oman
-
 Pakistan
-
 Palestine
-
 Panama
-
 Papua New Guinea
-
 Paraguay
-
 Peru
Peru
-
 Philippines
-
 Poland
-
 Portugal
-
 Puerto Rico
-
 Qatar
Qatar
-
 Reunion
-
 Romania
-
 Rwanda
-
 Saudi Arabia
-
 Serbia
-
 Singapore
-
 Slovakia
-
 Slovenia
-
 Somalia
-
 South Africa
-
 Spain
Spain
-
 Sri Lanka
-
 Sweden
-
 Switzerland
-
 Syria
Syria
-
 Taiwan
-
 Tajikistan
-
 Tanzania
-
 Thailand
-
 Trinidad and Tobago
-
 Tunisia
-
 Turkey
-
 UAE
UAE
-
 Uganda
-
 Ukraine
-
 United Kingdom
-
United States
-
 Uruguay
-
 Uzbekistan
-
 Venezuela
-
 Vietnam
-
 Yemen
Yemen
-
 Zambia
-
 Zimbabwe
- Forex
- Crypto
