
Microsoft stock consolidates as strong earnings face bearish technicals and Azure growth worries

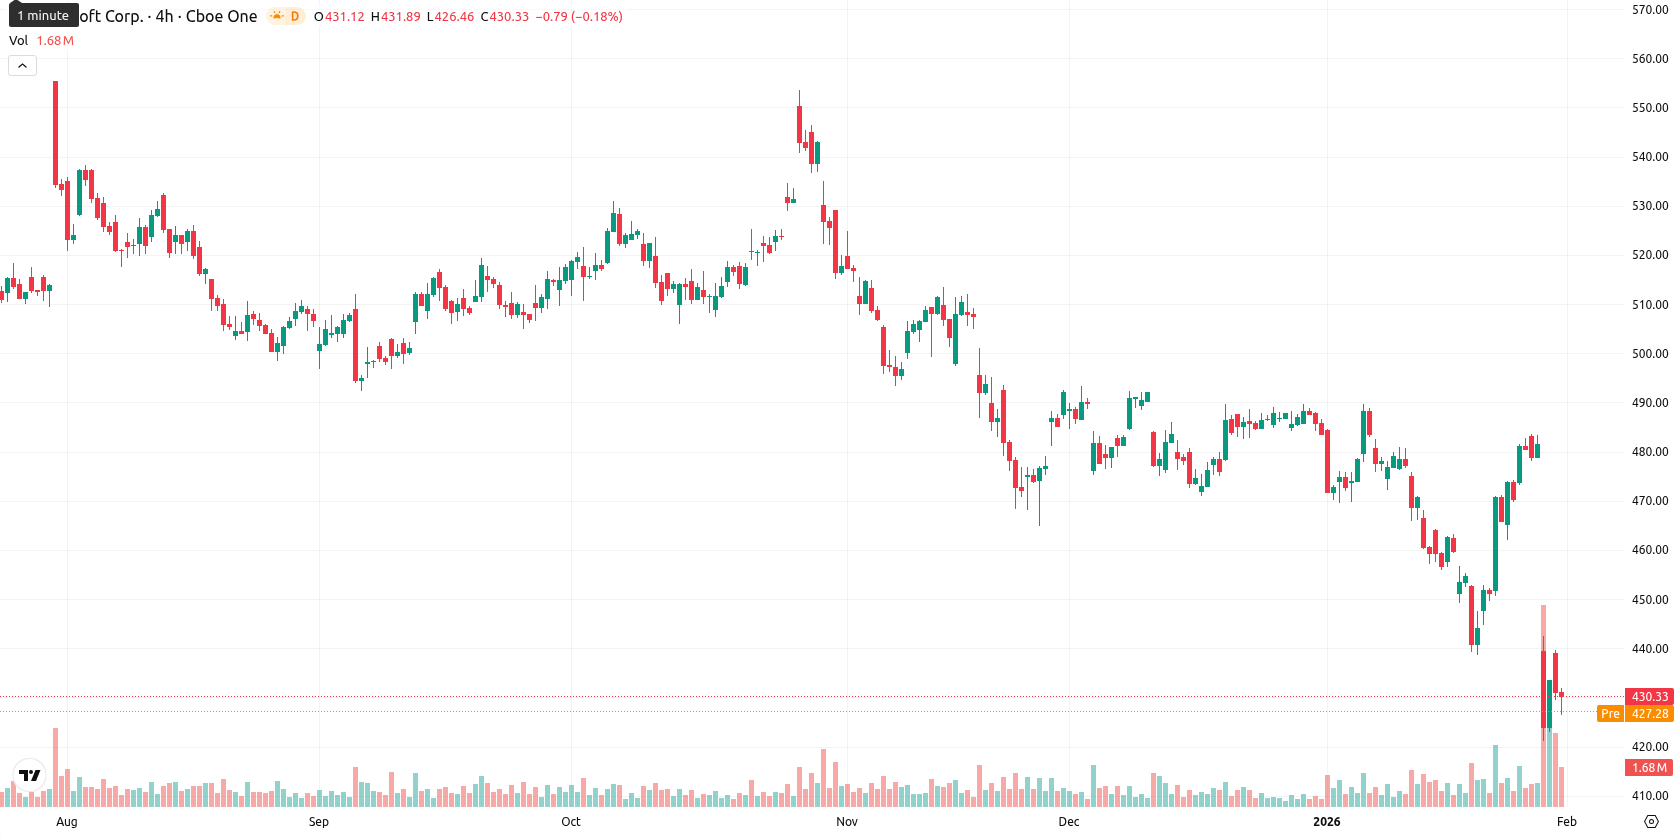
Microsoft Corporation (MSFT) is trading at $430.16 after a daily decline of 0.77%, moving well below its MA-20 ($465.04), MA-50 ($476.09), and MA-200 ($485.93) levels. This places the stock under persistent bearish pressure across all major timeframes, with the nearest resistance at the Ichimoku Kijun level of $455.36.
Highlights
- Microsoft delivered strong fiscal Q2 2026 results, posting revenue of $81.3 billion and adjusted EPS of $4.14, both exceeding analyst estimates.
- Azure’s growth rate decelerated, and investors expressed concern over high capital expenditures tied to the company’s AI infrastructure investments.
- MSFT trades at $430.16, below major moving averages, with bearish momentum; key resistance is $455.36 while strong support is near $428.00.
Strong earnings boost clouded by AI investment and Azure slowdown
Microsoft reported strong fiscal second-quarter 2026 results, achieving revenue of $81.3 billion and adjusted earnings per share of $4.14, surpassing analyst expectations. While growth remained robust across segments, Azure's growth rate showed some signs of deceleration. The market responded to concerns over elevated capital expenditures tied to investments in artificial intelligence infrastructure.
Oversold signals deepen as technical momentum skews decisively negative
Momentum indicators reinforce the ongoing downside for MSFT. The daily MACD and ADX confirm sustained selling pressure and a strengthening bearish trend, while RSI (32.58), CCI (–174.24), and Bull/Bear Power (–21.92, oversold) signal highly oversold conditions. The Awesome Oscillator also aligns with the negative bias, affirming continued seller dominance amid high intraday volatility.
Downside risk remains elevated as volatility constrains price action
MSFT is expected to trade within a 5-day volatility band between $428.00 and $438.00, closely centered around current levels. There is a high probability (over 80%) of further downside and a low likelihood of an upward reversal. The baseline scenario calls for sideways movement just above the $428.00 support, while a bullish reversal would require a break above $455.36, and persistent selling could bring support near $428.00 under renewed pressure.
Previously it was reported that Microsoft Corporation is trading significantly below all major moving averages, with technical indicators such as MACD, ADX, and momentum oscillators highlighting sustained bearish pressure and oversold conditions. Immediate downside risk persists, with support near the Ichimoku Kijun level, limited likelihood of a near-term rebound, and short-term price action expected to consolidate within a lower trading band.


Latest Microsoft News


-
 Afghanistan
-
 Albania
-
 Algeria
-
 Angola
-
 Argentina
-
 Armenia
-
 Australia
-
 Austria
-
 Azerbaijan
-
 Bahamas
-
 Bahrain
-
 Bangladesh
-
 Belarus
-
 Belgium
-
 Bolivia
-
 Botswana
-
 Brazil
-
 Brunei
-
 Bulgaria
-
 Cambodia
-
 Cameroon
-
 Canada
-
 Chile
Chile
-
 China
China
-
 Colombia
-
 Congo
Congo
-
 Costa Rica
-
 Cote d'Ivoire
-
 Croatia
-
 Cuba
Cuba
-
 Cyprus
-
 Czechia
-
 DR Congo
-
 Denmark
-
 Dominican Republic
-
 Ecuador
-
 Egypt
Egypt
-
 El Salvador
-
 Estonia
-
 Eswatini
-
 Ethiopia
-
 Finland
-
 France
-
 Georgia
-
 Germany
-
 Ghana
Ghana
-
 Greece
-
 Haiti
Haiti
-
 Hong Kong
-
 Hungary
-
 India
India
-
 Indonesia
-
 Iran, Islamic republic
-
 Iraq
Iraq
-
 Ireland
-
 Israel
-
 Italy
Italy
-
 Jamaica
-
 Japan
Japan
-
 Jordan
-
 Kazakhstan
-
 Kenya
Kenya
-
 Korea
Korea
-
 Kuwait
-
 Kyrgyzstan
-
 Laos
Laos
-
 Latvia
-
 Lebanon
-
 Lesotho
-
 Libya
Libya
-
 Lithuania
-
 Luxembourg
-
 Madagascar
-
 Malaysia
-
 Malta
Malta
-
 Mauritius
-
 Mexico
-
 Moldova
-
 Mongolia
-
 Montenegro
-
 Morocco
-
 Mozambique
-
 Myanmar
-
 Namibia
-
 Nepal
Nepal
-
 Netherlands
-
 New Zealand
-
 Nigeria
-
 North Macedonia
-
 Norway
-
 Oman
Oman
-
 Pakistan
-
 Palestine
-
 Panama
-
 Papua New Guinea
-
 Paraguay
-
 Peru
Peru
-
 Philippines
-
 Poland
-
 Portugal
-
 Puerto Rico
-
 Qatar
Qatar
-
 Reunion
-
 Romania
-
 Rwanda
-
 Saudi Arabia
-
 Serbia
-
 Singapore
-
 Slovakia
-
 Slovenia
-
 Somalia
-
 South Africa
-
 Spain
Spain
-
 Sri Lanka
-
 Sweden
-
 Switzerland
-
 Syria
Syria
-
 Taiwan
-
 Tajikistan
-
 Tanzania
-
 Thailand
-
 Trinidad and Tobago
-
 Tunisia
-
 Turkey
-
 UAE
UAE
-
 Uganda
-
 Ukraine
-
 United Kingdom
-
United States
-
 Uruguay
-
 Uzbekistan
-
 Venezuela
-
 Vietnam
-
 Yemen
Yemen
-
 Zambia
-
 Zimbabwe
- Forex
- Crypto
