
Microsoft stock: Sluggish cloud expansion and oversold signals drive a sharp decline

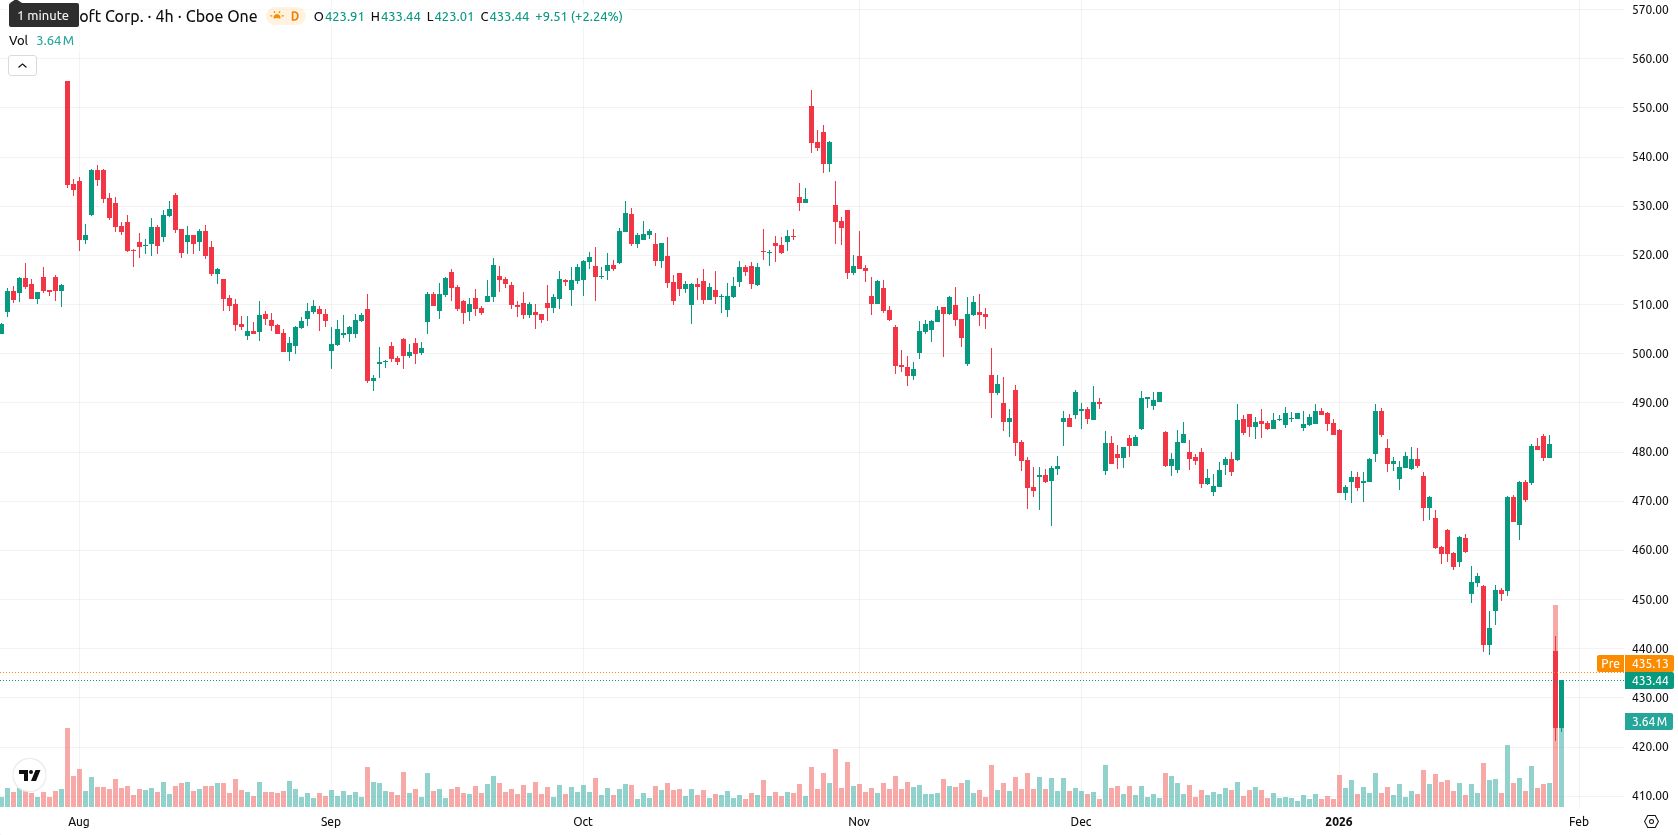
Microsoft Corporation (MSFT) is trading well below the MA-20 at $467.68, the MA-50 at $477.62, and the MA-200 at $485.72, which underscores strong selling pressure across all timeframes. The daily loss of 10.15% and persistent trading near the session lows are confirmed by the asset's position relative to these key moving averages.
Highlights
- Microsoft’s Q2 earnings surpassed Wall Street expectations, with cloud revenue topping $50 billion for the first time.
- Investor concerns focus on slower-than-expected cloud growth and rising capital expenditures for artificial intelligence, including expanded costs from OpenAI partnerships.
- Microsoft shares have dropped over 10% intraday, trading below key moving averages and near support at $420–$435, with downside risk dominating short-term technical outlook.
Profit margin worries rise as cloud growth and AI spending fuel debate
Microsoft reported its second quarter earnings, exceeding Wall Street expectations for both revenue and earnings per share, with cloud revenue crossing $50 billion for the first time. Despite the strong headline numbers, the company faces investor concerns about slower-than-anticipated cloud growth and increased capital spending on artificial intelligence initiatives. Higher expenses, particularly related to expanded partnerships like OpenAI, have also raised questions about short-term profit margins for Microsoft.
Downside momentum persists as bearish signals and oversold metrics align
Technical analysis highlights that Microsoft is significantly below all key moving averages, with the nearest dynamic support at the Ichimoku Kijun level of $455.44. Momentum indicators, such as MACD and ADX, show a pronounced sell bias, while RSI, Stochastic RSI, and CCI indicate oversold conditions. Bull/Bear Power is deeply negative and classified as oversold, confirming strong seller dominance intraday. The sharp gap down at the open and pressure near today's low of $421.18, coupled with high volatility, underline the persistent bearish tone and extended downside momentum.
Downside risk favored amid low odds of near-term rebound
Over the next five trading days, the typical volatility band is anticipated between $420 and $435, with less than a 20% probability of an upward move. Further declines are more likely, with baseline expectations calling for consolidation within the $420 to $435 range. A rebound above $435 could open the way to the Ichimoku Kijun or higher resistance, while a drop below $420 may accelerate short-term losses. All momentum and trend indicators currently skew risk to the downside, and only a modest chance of near-term stabilization is apparent.
Last time, analysts noted that Microsoft shares are trading well below key moving averages, with both the MA-20 and MA-50 now serving as overhead resistance levels. Despite strong earnings and continued AI demand, bearish price momentum persists as investor concerns over cloud growth slowdown and elevated capital spending weigh on near-term support for the stock.


Latest Microsoft News


-
 Afghanistan
-
 Albania
-
 Algeria
-
 Angola
-
 Argentina
-
 Armenia
-
 Australia
-
 Austria
-
 Azerbaijan
-
 Bahamas
-
 Bahrain
-
 Bangladesh
-
 Belarus
-
 Belgium
-
 Bolivia
-
 Botswana
-
 Brazil
-
 Brunei
-
 Bulgaria
-
 Cambodia
-
 Cameroon
-
 Canada
-
 Chile
Chile
-
 China
China
-
 Colombia
-
 Congo
Congo
-
 Costa Rica
-
 Cote d'Ivoire
-
 Croatia
-
 Cuba
Cuba
-
 Cyprus
-
 Czechia
-
 DR Congo
-
 Denmark
-
 Dominican Republic
-
 Ecuador
-
 Egypt
Egypt
-
 El Salvador
-
 Estonia
-
 Eswatini
-
 Ethiopia
-
 Finland
-
 France
-
 Georgia
-
 Germany
-
 Ghana
Ghana
-
 Greece
-
 Haiti
Haiti
-
 Hong Kong
-
 Hungary
-
 India
India
-
 Indonesia
-
 Iran, Islamic republic
-
 Iraq
Iraq
-
 Ireland
-
 Israel
-
 Italy
Italy
-
 Jamaica
-
 Japan
Japan
-
 Jordan
-
 Kazakhstan
-
 Kenya
Kenya
-
 Korea
Korea
-
 Kuwait
-
 Kyrgyzstan
-
 Laos
Laos
-
 Latvia
-
 Lebanon
-
 Lesotho
-
 Libya
Libya
-
 Lithuania
-
 Luxembourg
-
 Madagascar
-
 Malaysia
-
 Malta
Malta
-
 Mauritius
-
 Mexico
-
 Moldova
-
 Mongolia
-
 Montenegro
-
 Morocco
-
 Mozambique
-
 Myanmar
-
 Namibia
-
 Nepal
Nepal
-
 Netherlands
-
 New Zealand
-
 Nigeria
-
 North Macedonia
-
 Norway
-
 Oman
Oman
-
 Pakistan
-
 Palestine
-
 Panama
-
 Papua New Guinea
-
 Paraguay
-
 Peru
Peru
-
 Philippines
-
 Poland
-
 Portugal
-
 Puerto Rico
-
 Qatar
Qatar
-
 Reunion
-
 Romania
-
 Rwanda
-
 Saudi Arabia
-
 Serbia
-
 Singapore
-
 Slovakia
-
 Slovenia
-
 Somalia
-
 South Africa
-
 Spain
Spain
-
 Sri Lanka
-
 Sweden
-
 Switzerland
-
 Syria
Syria
-
 Taiwan
-
 Tajikistan
-
 Tanzania
-
 Thailand
-
 Trinidad and Tobago
-
 Tunisia
-
 Turkey
-
 UAE
UAE
-
 Uganda
-
 Ukraine
-
 United Kingdom
-
United States
-
 Uruguay
-
 Uzbekistan
-
 Venezuela
-
 Vietnam
-
 Yemen
Yemen
-
 Zambia
-
 Zimbabwe
- Forex
- Crypto
