
Microsoft stock climbs 2.17% as record $627B Azure cloud backlog lifts growth outlook

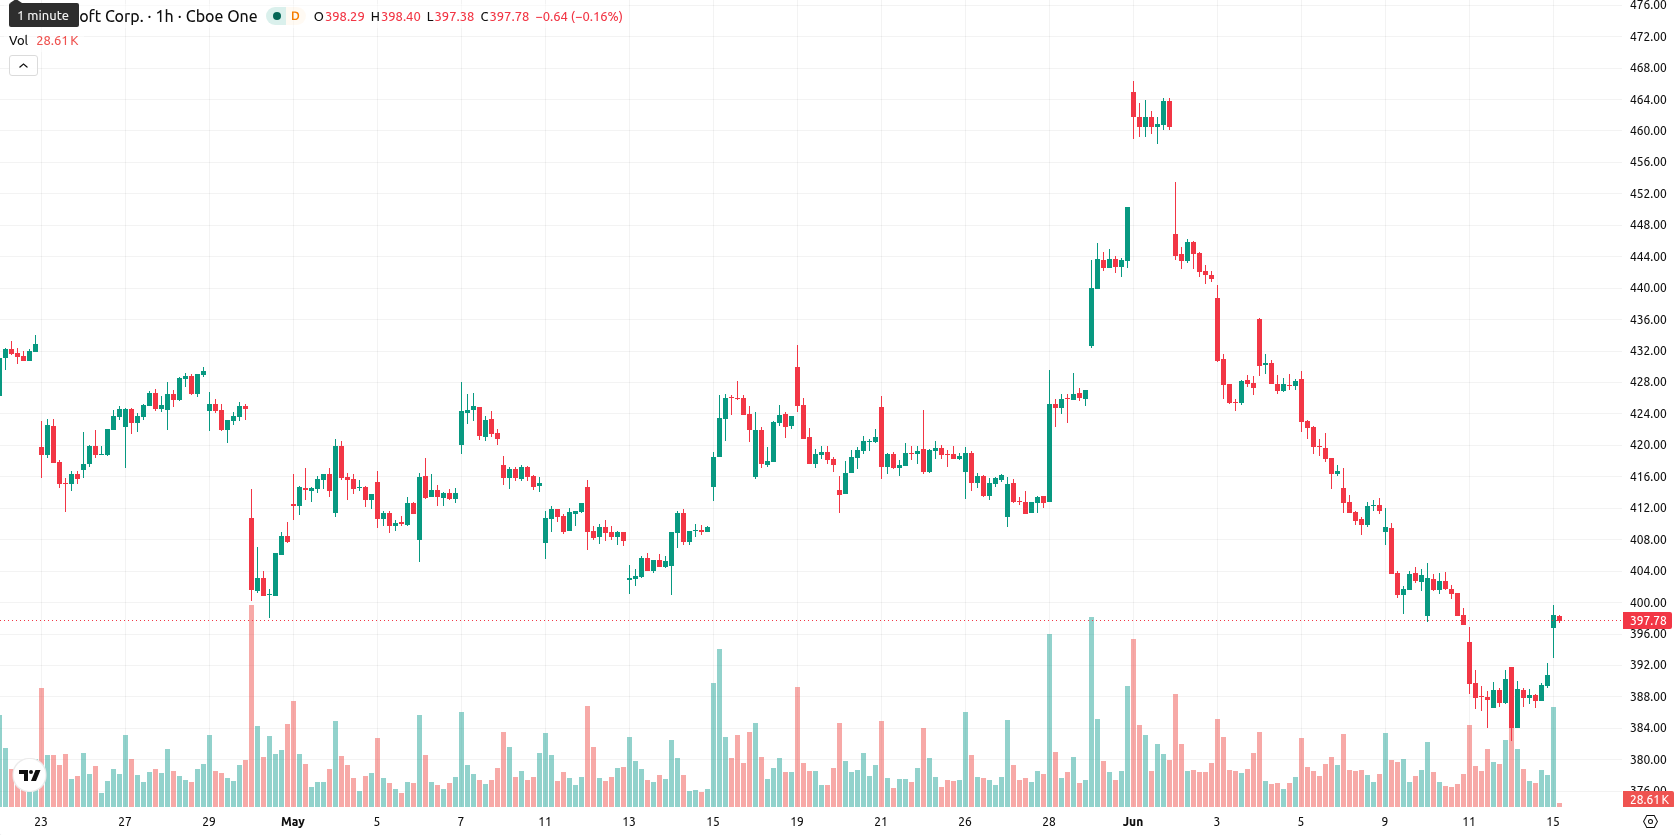
Microsoft Corporation (MSFT) stock is trading at $398.59, showing a daily gain of 2.17%. The price is currently positioned above its key moving averages in the short term, but remains below medium- and long-term averages.
Highlights
- Microsoft reported 18% year-over-year revenue growth to $82.9 billion and a 23% earnings per share increase for Q1 2026.
- An executive sold 4,500 shares for $1.81 million amid robust Azure cloud backlog of $627 billion and steady $0.91 dividend.
- MSFT faces high bearish probability despite recent price gains, with near-term trading likely between $385.48 and $411.70.
Insider sales prompt executive sentiment scrutiny as fundamentals surge
A notable insider transaction occurred as Executive Vice President and Chief Marketing Officer Takeshi Numoto sold 4,500 Microsoft shares for $1,812,780, a move disclosed in the SEC's Form 4 filing that may prompt heightened scrutiny of executive sentiment. Microsoft's robust operational performance is reflected in its 18% year-over-year revenue growth to $82.9 billion, alongside a 20% increase in operating income to $38.4 billion and a 23% rise in earnings per share to $4.27 for the quarter ended March 2026. The company also reported a record $627 billion Azure cloud backlog, complementing maintained quarterly dividends of $0.91 per share with the next ex-dividend date set for August 20, 2026, highlighting ongoing strength across both growth and income channels.
Intraday strength contrasts with persistent bearish momentum signals
Technically, MSFT is trading above its MA-20 but remains below both the MA-50 on the H1 chart and the long-term MA-200. Immediate support is defined by the Ichimoku Kijun at $393.66. Momentum signals are heavily bearish, with MACD showing a strong sell, ADX confirming a sell bias, and RSI signaling sell. Stoch RSI and BBP are both overbought, indicating persistent buyer dominance even as momentum wanes. CCI is neutral at present. Price closed near the session high, highlighting the divergence between intraday strength and the broader negative momentum backdrop.
Downside risk dominates outlook as volatility constrains upside
For the short term, MSFT is expected to trade within a volatility band between $385.48 and $411.70 over the next several sessions. Upside probability is considered very low, while the likelihood of downward movement remains high, pointing to limited potential for further gains. The baseline scenario is for price consolidation inside this range. A break above resistance would open a bullish scenario, whereas a clear move below $385.48 support would likely accelerate downside momentum.
Earlier, analysts noted that Microsoft faced persistent technical weakness and elevated regulatory and litigation risks that were weighing on investor sentiment. The current setup, with bearish momentum signals outweighing recent gains and insider selling activity, suggests that traders should closely monitor the $393.66 Ichimoku Kijun level as a critical indicator for any shift in directional bias.


Latest Microsoft News


-
 Afghanistan
-
 Albania
-
 Algeria
-
 Angola
-
 Argentina
-
 Armenia
-
 Australia
-
 Austria
-
 Azerbaijan
-
 Bahamas
-
 Bahrain
-
 Bangladesh
-
 Belarus
-
 Belgium
-
 Bolivia
-
 Botswana
-
 Brazil
-
 Brunei
-
 Bulgaria
-
 Cambodia
-
 Cameroon
-
 Canada
-
 Chile
Chile
-
 China
China
-
 Colombia
-
 Congo
Congo
-
 Costa Rica
-
 Cote d'Ivoire
-
 Croatia
-
 Cuba
Cuba
-
 Cyprus
-
 Czechia
-
 DR Congo
-
 Denmark
-
 Dominican Republic
-
 Ecuador
-
 Egypt
Egypt
-
 El Salvador
-
 Estonia
-
 Eswatini
-
 Ethiopia
-
 Finland
-
 France
-
 Georgia
-
 Germany
-
 Ghana
Ghana
-
 Greece
-
 Haiti
Haiti
-
 Hong Kong
-
 Hungary
-
 India
India
-
 Indonesia
-
 Iran, Islamic republic
-
 Iraq
Iraq
-
 Ireland
-
 Israel
-
 Italy
Italy
-
 Jamaica
-
 Japan
Japan
-
 Jordan
-
 Kazakhstan
-
 Kenya
Kenya
-
 Korea
Korea
-
 Kuwait
-
 Kyrgyzstan
-
 Laos
Laos
-
 Latvia
-
 Lebanon
-
 Lesotho
-
 Libya
Libya
-
 Lithuania
-
 Luxembourg
-
 Madagascar
-
 Malaysia
-
 Malta
Malta
-
 Mauritius
-
 Mexico
-
 Moldova
-
 Mongolia
-
 Montenegro
-
 Morocco
-
 Mozambique
-
 Myanmar
-
 Namibia
-
 Nepal
Nepal
-
 Netherlands
-
 New Zealand
-
 Nigeria
-
 North Macedonia
-
 Norway
-
 Oman
Oman
-
 Pakistan
-
 Palestine
-
 Panama
-
 Papua New Guinea
-
 Paraguay
-
 Peru
Peru
-
 Philippines
-
 Poland
-
 Portugal
-
 Puerto Rico
-
 Qatar
Qatar
-
 Reunion
-
 Romania
-
 Rwanda
-
 Saudi Arabia
-
 Serbia
-
 Singapore
-
 Slovakia
-
 Slovenia
-
 Somalia
-
 South Africa
-
 Spain
Spain
-
 Sri Lanka
-
 Sweden
-
 Switzerland
-
 Syria
Syria
-
 Taiwan
-
 Tajikistan
-
 Tanzania
-
 Thailand
-
 Trinidad and Tobago
-
 Tunisia
-
 Turkey
-
 UAE
UAE
-
 Uganda
-
 Ukraine
-
 United Kingdom
-
United States
-
 Uruguay
-
 Uzbekistan
-
 Venezuela
-
 Vietnam
-
 Yemen
Yemen
-
 Zambia
-
 Zimbabwe
- Forex
- Crypto
