
Nano Dimension stock: Divergent oscillators hint at caution while price gains 3.06%

Nano Dimension Ltd (NNDM) is currently trading at $1.83, which is above the MA-20 ($1.76), MA-50 ($1.73), and MA-200 ($1.59). This arrangement highlights an ongoing bullish structure for the short, medium, and long term, with dynamic support from the Ichimoku Kijun and MA-50 near $1.74.
Highlights
- NNDM is trading at $1.83, above the MA-20 ($1.76), MA-50 ($1.73), and MA-200 ($1.59), confirming a bullish structure across timeframes.
- MACD and ADX reflect mild upward momentum, while CCI and Stochastic RSI suggest potential for a short-term bounce from oversold conditions.
- Key technical levels include intraday support at $1.74 and resistance at $1.85; a breakout above $1.85 would signal a stronger bullish move.
Mixed intraday signals as divergent oscillators temper positive momentum
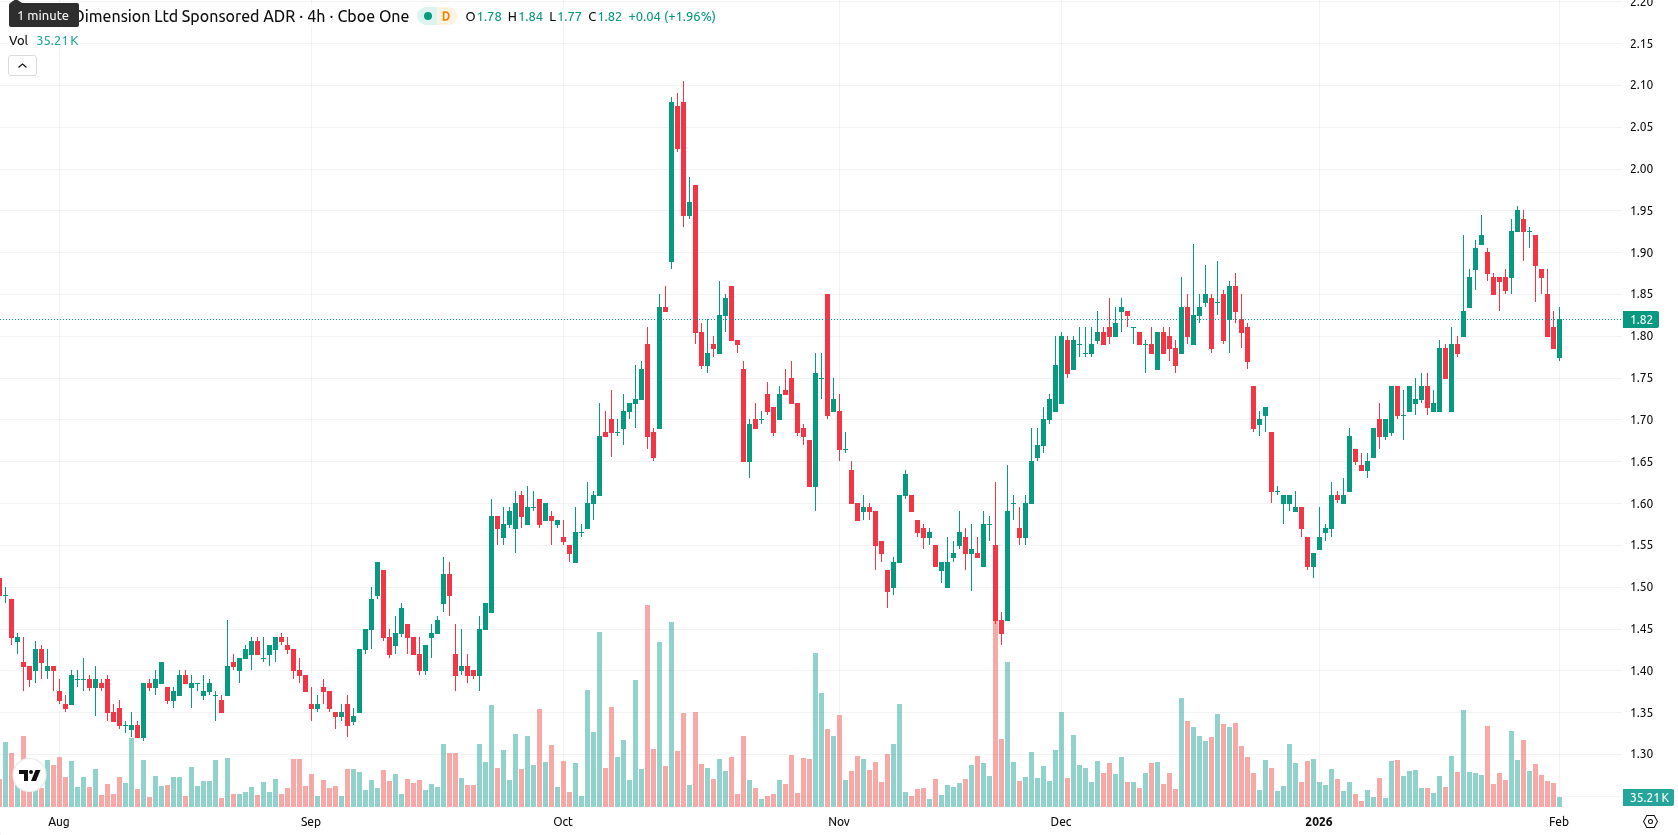
Momentum on daily timeframes is positive, with the MACD and ADX pointing to mild upward strength but not an aggressive trend. The RSI is neutral to positive near 50, while the Stochastic RSI signals oversold conditions and the CCI is neutral, hinting at the potential for a short-term bounce. Bull/Bear Power is modestly positive, showing buyers have the upper hand intraday. The Awesome Oscillator is neutral, not reinforcing either trend. The stock gained 3.06% today, opening without a gap at $1.78, and now sits near the top of its $1.77 – $1.84 daily range. Intraday volatility has been moderate, with price action exhibiting consistent strength toward session highs and mild persistent upward tone. The divergence across oscillators and momentum indicators suggests some caution despite the bullish daily move.
Narrow consolidation likely as bullish odds prevail on technical alignment
For the week ahead, NNDM is expected to trade in a range of $1.83 to $1.85. The probability of an increase is 75%, with a decline less likely based on the alignment of weekly Moving Averages, RSI, and MACD. The baseline scenario sees the stock consolidating in a narrow sideways pattern between $1.83 and $1.85. A bullish scenario would be triggered by a break above $1.85, paving the way for higher targets. Alternatively, if price slips below the $1.74 support zone, a bearish move toward the next lower cluster of moving averages may develop.
Previously it was reported that Nano Dimension Ltd is maintaining a bullish structure, with the price above key moving averages (MA-20, MA-50, MA-200) and constructive signals from MACD, ADX, and RSI, supported by dynamic support around $1.74. Despite strong daily momentum and buyer dominance, weak intraday action and closing near session lows suggest a potential pause or short-term pullback within an overall bullish trend, with the price likely to move sideways in the coming days.


Latest Nano Dimension News


-
 Afghanistan
-
 Albania
-
 Algeria
-
 Angola
-
 Argentina
-
 Armenia
-
 Australia
-
 Austria
-
 Azerbaijan
-
 Bahamas
-
 Bahrain
-
 Bangladesh
-
 Belarus
-
 Belgium
-
 Bolivia
-
 Botswana
-
 Brazil
-
 Brunei
-
 Bulgaria
-
 Cambodia
-
 Cameroon
-
 Canada
-
 Chile
Chile
-
 China
China
-
 Colombia
-
 Congo
Congo
-
 Costa Rica
-
 Cote d'Ivoire
-
 Croatia
-
 Cuba
Cuba
-
 Cyprus
-
 Czechia
-
 DR Congo
-
 Denmark
-
 Dominican Republic
-
 Ecuador
-
 Egypt
Egypt
-
 El Salvador
-
 Estonia
-
 Eswatini
-
 Ethiopia
-
 Finland
-
 France
-
 Georgia
-
 Germany
-
 Ghana
Ghana
-
 Greece
-
 Haiti
Haiti
-
 Hong Kong
-
 Hungary
-
 India
India
-
 Indonesia
-
 Iran, Islamic republic
-
 Iraq
Iraq
-
 Ireland
-
 Israel
-
 Italy
Italy
-
 Jamaica
-
 Japan
Japan
-
 Jordan
-
 Kazakhstan
-
 Kenya
Kenya
-
 Korea
Korea
-
 Kuwait
-
 Kyrgyzstan
-
 Laos
Laos
-
 Latvia
-
 Lebanon
-
 Lesotho
-
 Libya
Libya
-
 Lithuania
-
 Luxembourg
-
 Madagascar
-
 Malaysia
-
 Malta
Malta
-
 Mauritius
-
 Mexico
-
 Moldova
-
 Mongolia
-
 Montenegro
-
 Morocco
-
 Mozambique
-
 Myanmar
-
 Namibia
-
 Nepal
Nepal
-
 Netherlands
-
 New Zealand
-
 Nigeria
-
 North Macedonia
-
 Norway
-
 Oman
Oman
-
 Pakistan
-
 Palestine
-
 Panama
-
 Papua New Guinea
-
 Paraguay
-
 Peru
Peru
-
 Philippines
-
 Poland
-
 Portugal
-
 Puerto Rico
-
 Qatar
Qatar
-
 Reunion
-
 Romania
-
 Rwanda
-
 Saudi Arabia
-
 Serbia
-
 Singapore
-
 Slovakia
-
 Slovenia
-
 Somalia
-
 South Africa
-
 Spain
Spain
-
 Sri Lanka
-
 Sweden
-
 Switzerland
-
 Syria
Syria
-
 Taiwan
-
 Tajikistan
-
 Tanzania
-
 Thailand
-
 Trinidad and Tobago
-
 Tunisia
-
 Turkey
-
 UAE
UAE
-
 Uganda
-
 Ukraine
-
 United Kingdom
-
United States
-
 Uruguay
-
 Uzbekistan
-
 Venezuela
-
 Vietnam
-
 Yemen
Yemen
-
 Zambia
-
 Zimbabwe
- Forex
- Crypto
