
-3.21% for Nano Dimension stock — bullish trend pauses after volatile session

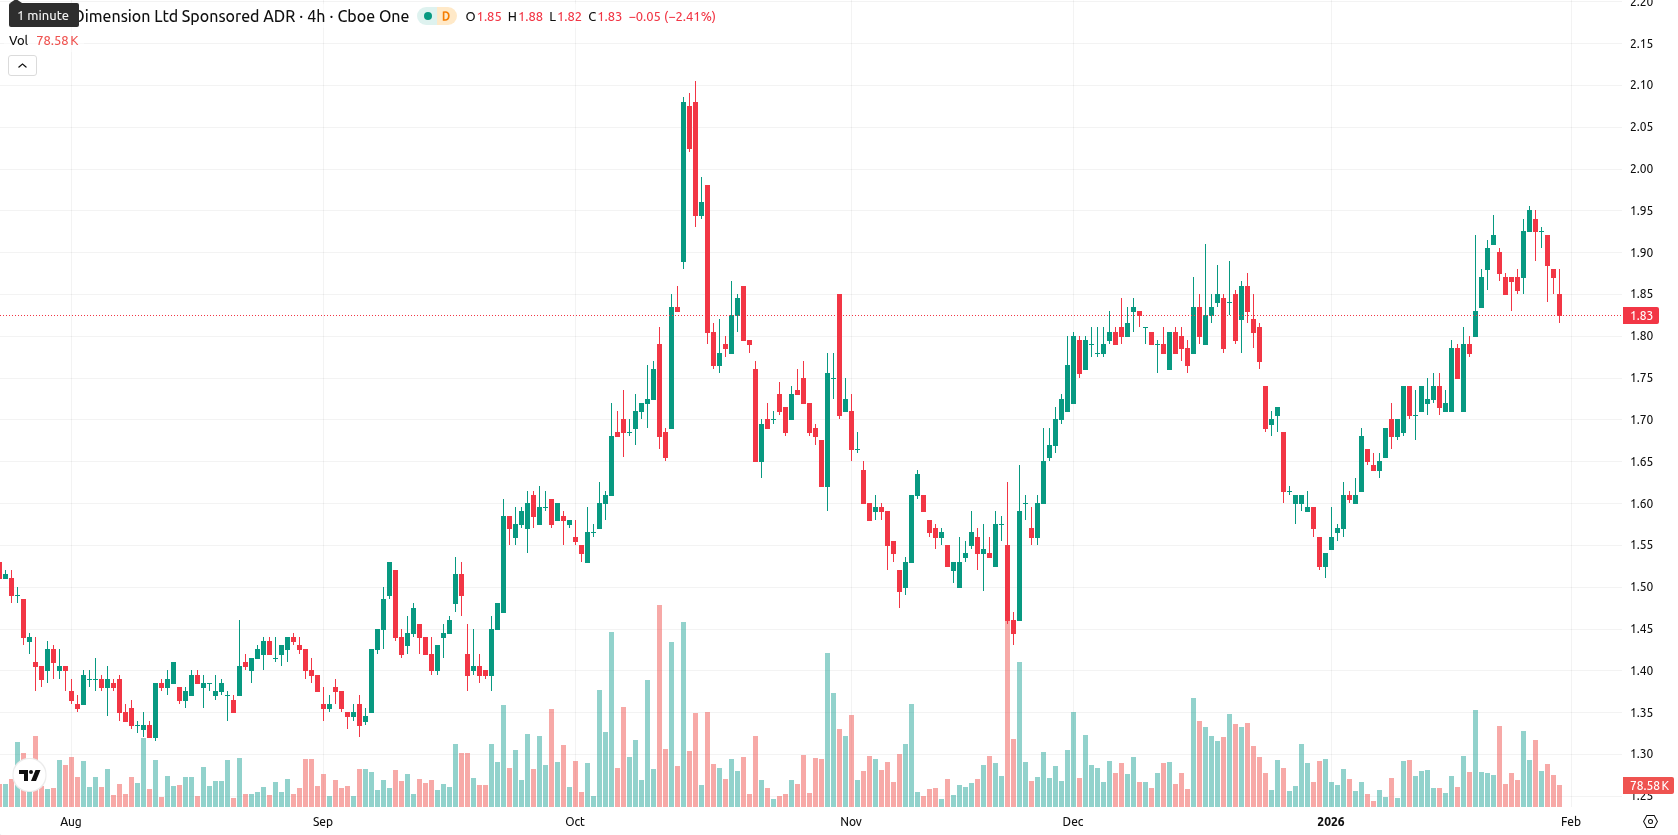
Nano Dimension Ltd (NNDM) is trading at $1.81, which places it above the MA-20 of $1.75 and the MA-50 of $1.73, confirming sustained bullish structure for both the short and medium term. The price also sits above the MA-200 of $1.58, indicating robust long-term support, while the nearest dynamic support from the Ichimoku Kijun is at $1.74 and MA-50 now acts as the first resistance.
Highlights
- NNDM trades at $1.81, remaining above its MA-20 ($1.75), MA-50 ($1.73), and MA-200 ($1.58), reinforcing a sustained bullish technical structure.
- Daily MACD, ADX, RSI (59.22), and CCI (86.33) all show mild bullish momentum, but intraday price action is weak with a 3.21% decline from the open.
- Key levels are $1.74 (Kijun/near-term support) and $1.90 (weekly resistance); the next five-day range is likely $1.62–$1.90 barring a break below support.
Bullish momentum diverges from weak intraday action
Momentum signals remain constructive, with daily MACD and ADX both indicating a buying bias, though momentum appears moderate. The RSI at 59.22 and CCI at 86.33 both reflect mild bullishness without clear overbought warnings, while Stochastic RSI is neutral near 37.67. Bull/Bear Power signals strong buyer dominance intraday, but despite this, the Awesome Oscillator stays neutral, hinting that trend momentum is not exceptional. Today’s price opened just below the previous close ($1.85 vs. $1.87, a tiny downside gap), and has since moved down 3.21% to the low of the day within a moderate intraday volatility range, suggesting heavy selling pressure after the open and a close near intraday lows. There is notable divergence between broad bullish daily indicators and weak intraday action, which may indicate a pause or pullback within a bullish structure.
Sideways movement favored as upside odds remain elevated
For the next five trading days, the adjusted weekly range is likely to be $1.62 to $1.90. Based on weekly indicators — three showing “Buy” and one showing “Sell” — the probability of a price increase is high (around 75%), making a decline much less likely. The baseline scenario is sideways movement within the $1.62 to $1.90 corridor. In the bullish scenario, a close above $1.90 could spark a move to new local highs, while a break below $1.62 would trigger further downside as technical support sits nearby.
Last time, analysts noted that Nano Dimension was trading above its key moving averages with a bullish structure, supported by positive momentum indicators such as the MACD and ADX, while the RSI remained in bullish territory but not overbought. While immediate support is seen near $1.74 and resistance around $1.95 to $2.00, overbought signals on the Stochastic RSI and CCI suggest caution, with expectations of sideways movement and a possible upside breakout if momentum sustains.


Latest Nano Dimension News


-
 Afghanistan
-
 Albania
-
 Algeria
-
 Angola
-
 Argentina
-
 Armenia
-
 Australia
-
 Austria
-
 Azerbaijan
-
 Bahamas
-
 Bahrain
-
 Bangladesh
-
 Belarus
-
 Belgium
-
 Bolivia
-
 Botswana
-
 Brazil
-
 Brunei
-
 Bulgaria
-
 Cambodia
-
 Cameroon
-
 Canada
-
 Chile
Chile
-
 China
China
-
 Colombia
-
 Congo
Congo
-
 Costa Rica
-
 Cote d'Ivoire
-
 Croatia
-
 Cuba
Cuba
-
 Cyprus
-
 Czechia
-
 DR Congo
-
 Denmark
-
 Dominican Republic
-
 Ecuador
-
 Egypt
Egypt
-
 El Salvador
-
 Estonia
-
 Eswatini
-
 Ethiopia
-
 Finland
-
 France
-
 Georgia
-
 Germany
-
 Ghana
Ghana
-
 Greece
-
 Haiti
Haiti
-
 Hong Kong
-
 Hungary
-
 India
India
-
 Indonesia
-
 Iran, Islamic republic
-
 Iraq
Iraq
-
 Ireland
-
 Israel
-
 Italy
Italy
-
 Jamaica
-
 Japan
Japan
-
 Jordan
-
 Kazakhstan
-
 Kenya
Kenya
-
 Korea
Korea
-
 Kuwait
-
 Kyrgyzstan
-
 Laos
Laos
-
 Latvia
-
 Lebanon
-
 Lesotho
-
 Libya
Libya
-
 Lithuania
-
 Luxembourg
-
 Madagascar
-
 Malaysia
-
 Malta
Malta
-
 Mauritius
-
 Mexico
-
 Moldova
-
 Mongolia
-
 Montenegro
-
 Morocco
-
 Mozambique
-
 Myanmar
-
 Namibia
-
 Nepal
Nepal
-
 Netherlands
-
 New Zealand
-
 Nigeria
-
 North Macedonia
-
 Norway
-
 Oman
Oman
-
 Pakistan
-
 Palestine
-
 Panama
-
 Papua New Guinea
-
 Paraguay
-
 Peru
Peru
-
 Philippines
-
 Poland
-
 Portugal
-
 Puerto Rico
-
 Qatar
Qatar
-
 Reunion
-
 Romania
-
 Rwanda
-
 Saudi Arabia
-
 Serbia
-
 Singapore
-
 Slovakia
-
 Slovenia
-
 Somalia
-
 South Africa
-
 Spain
Spain
-
 Sri Lanka
-
 Sweden
-
 Switzerland
-
 Syria
Syria
-
 Taiwan
-
 Tajikistan
-
 Tanzania
-
 Thailand
-
 Trinidad and Tobago
-
 Tunisia
-
 Turkey
-
 UAE
UAE
-
 Uganda
-
 Ukraine
-
 United Kingdom
-
United States
-
 Uruguay
-
 Uzbekistan
-
 Venezuela
-
 Vietnam
-
 Yemen
Yemen
-
 Zambia
-
 Zimbabwe
- Forex
- Crypto
