
Adobe stock: Bearish indicators and management policy shifts fuel downside move

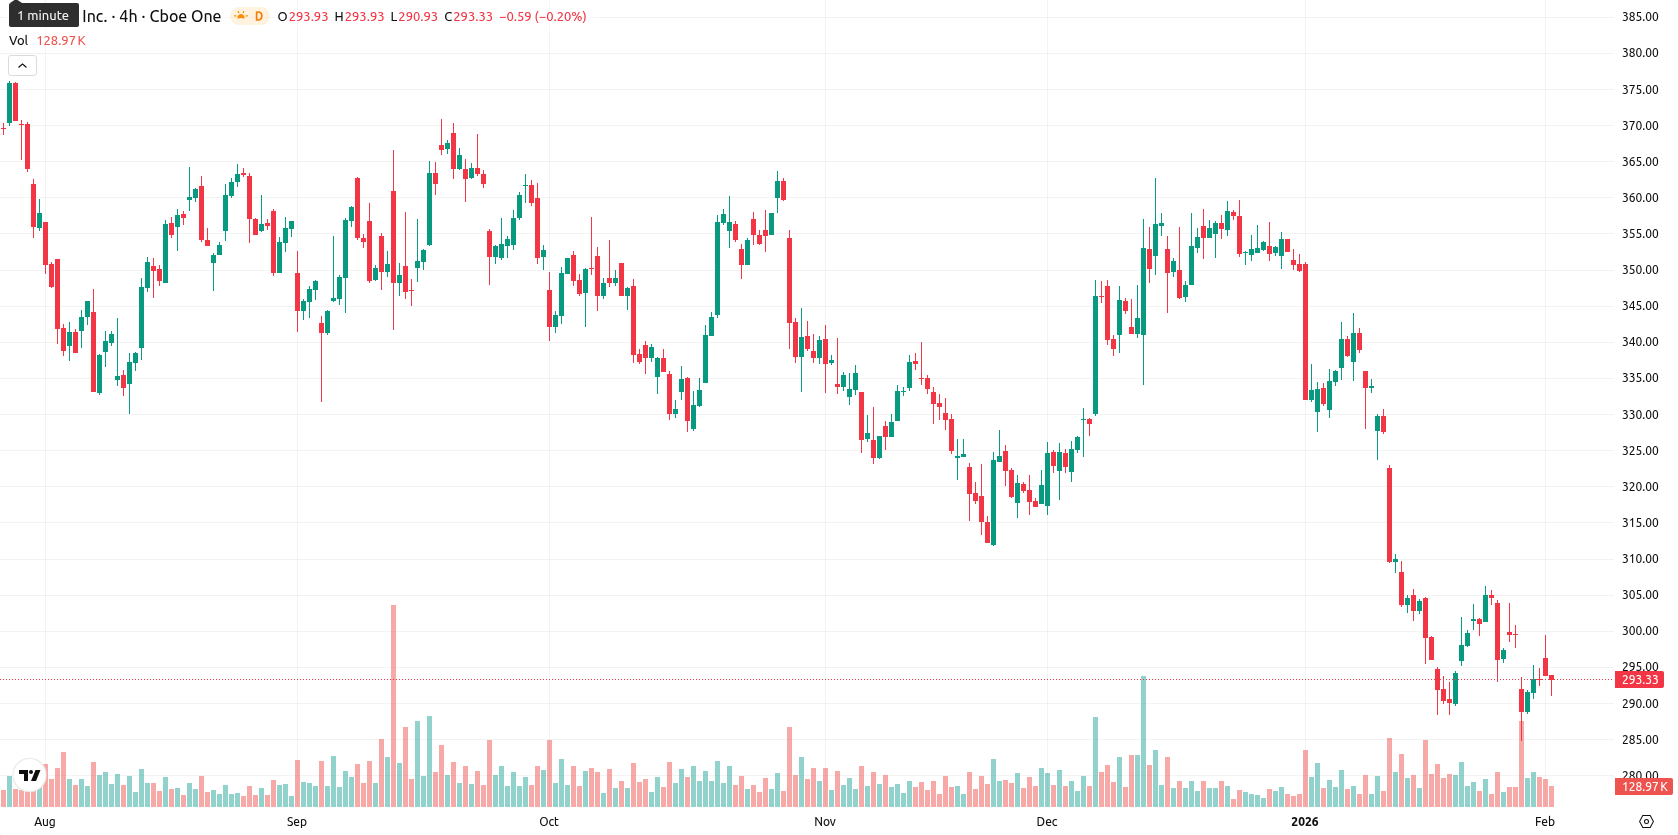
Adobe Inc. (ADBE) shares are currently trading at $283.00, notably below key moving averages: the MA-20 at $309.31, MA-50 at $327.37, and MA-200 at $356.00. This alignment highlights strong and persistent seller pressure across all timeframes, with dynamic resistance set by the Ichimoku Kijun at $320.64.
Highlights
- Adobe revised its executive compensation policy by tightening senior leadership bonuses to meeting at least 95% of 2026 revenue and EPS targets, with a 155% cap.
- Adobe will discontinue Adobe Animate, its 2D animation software, in 2026, while institutional ownership shifts saw UMB Bank n.a. reduce holdings by 40% and others increase stakes.
- Adobe shares at $283.00 trade below the MA-20, MA-50, and MA-200; technical indicators signal strong bearish momentum with a high probability of further downside below $280.
Executive pay overhaul and product exit reshape investor positioning
Adobe has revised its executive compensation policy, introducing stricter performance criteria for senior leadership bonuses tied to meeting at least 95% of 2026 revenue and EPS targets and implementing a 155% cap. The company also announced it will discontinue Adobe Animate, its 2D animation software, in 2026, ending a 25-year run. Changes in institutional ownership have been observed, including UMB Bank n.a. reducing its holdings by 40% and Jones Financial Companies and Atlantic Union Bankshares increasing their stakes.
Bearish momentum solidifies amid persistent selling and oversold signals
MACD and ADX on the daily chart both indicate clear downside momentum, confirming a strong bearish tilt. Oversold readings from RSI (32.27) and Bull/Bear Power (–2.37), along with a “Sell” from CCI and “Oversold” readings from Stochastic RSI, reveal dominant seller control intraday. A deep negative daily swing is evident, as the price opened with a gap down from $293.27 to $282.50 and now sits near today’s high after a small bounce inside a low-volatility $2.87 range, but downside pressure persists after the open. Awesome Oscillator also confirms the prevailing bearish momentum.
Range-bound trade expected as downside risk outweighs upside
Over the next five sessions, Adobe is expected to trade within the $280 – $289 range, consistent with typical volatility relative to current levels and the revised weekly outlook. There is a very high probability (greater than 80%) of continued downside according to key daily and weekly indicators, while a recovery remains unlikely. Sideways consolidation near support is the baseline scenario; a bullish move would require a sustained break above $291 and the $320.64 Kijun resistance, while a drop below $280 would strengthen the current bearish trend.
Previously it was reported that Adobe Inc. is exhibiting sustained bearish momentum, trading well below its key moving averages with momentum indicators such as MACD, ADX, and RSI all confirming ongoing downside pressure and near-oversold conditions. Immediate resistance is seen at the Ichimoku Kijun line, and while investor accumulation and robust AI-driven revenues support sentiment, a further decline remains likely unless the $324.00 level is decisively breached.


Latest Adobe News


-
 Afghanistan
-
 Albania
-
 Algeria
-
 Angola
-
 Argentina
-
 Armenia
-
 Australia
-
 Austria
-
 Azerbaijan
-
 Bahamas
-
 Bahrain
-
 Bangladesh
-
 Belarus
-
 Belgium
-
 Bolivia
-
 Botswana
-
 Brazil
-
 Brunei
-
 Bulgaria
-
 Cambodia
-
 Cameroon
-
 Canada
-
 Chile
Chile
-
 China
China
-
 Colombia
-
 Congo
Congo
-
 Costa Rica
-
 Cote d'Ivoire
-
 Croatia
-
 Cuba
Cuba
-
 Cyprus
-
 Czechia
-
 DR Congo
-
 Denmark
-
 Dominican Republic
-
 Ecuador
-
 Egypt
Egypt
-
 El Salvador
-
 Estonia
-
 Eswatini
-
 Ethiopia
-
 Finland
-
 France
-
 Georgia
-
 Germany
-
 Ghana
Ghana
-
 Greece
-
 Haiti
Haiti
-
 Hong Kong
-
 Hungary
-
 India
India
-
 Indonesia
-
 Iran, Islamic republic
-
 Iraq
Iraq
-
 Ireland
-
 Israel
-
 Italy
Italy
-
 Jamaica
-
 Japan
Japan
-
 Jordan
-
 Kazakhstan
-
 Kenya
Kenya
-
 Korea
Korea
-
 Kuwait
-
 Kyrgyzstan
-
 Laos
Laos
-
 Latvia
-
 Lebanon
-
 Lesotho
-
 Libya
Libya
-
 Lithuania
-
 Luxembourg
-
 Madagascar
-
 Malaysia
-
 Malta
Malta
-
 Mauritius
-
 Mexico
-
 Moldova
-
 Mongolia
-
 Montenegro
-
 Morocco
-
 Mozambique
-
 Myanmar
-
 Namibia
-
 Nepal
Nepal
-
 Netherlands
-
 New Zealand
-
 Nigeria
-
 North Macedonia
-
 Norway
-
 Oman
Oman
-
 Pakistan
-
 Palestine
-
 Panama
-
 Papua New Guinea
-
 Paraguay
-
 Peru
Peru
-
 Philippines
-
 Poland
-
 Portugal
-
 Puerto Rico
-
 Qatar
Qatar
-
 Reunion
-
 Romania
-
 Rwanda
-
 Saudi Arabia
-
 Serbia
-
 Singapore
-
 Slovakia
-
 Slovenia
-
 Somalia
-
 South Africa
-
 Spain
Spain
-
 Sri Lanka
-
 Sweden
-
 Switzerland
-
 Syria
Syria
-
 Taiwan
-
 Tajikistan
-
 Tanzania
-
 Thailand
-
 Trinidad and Tobago
-
 Tunisia
-
 Turkey
-
 UAE
UAE
-
 Uganda
-
 Ukraine
-
 United Kingdom
-
United States
-
 Uruguay
-
 Uzbekistan
-
 Venezuela
-
 Vietnam
-
 Yemen
Yemen
-
 Zambia
-
 Zimbabwe
- Forex
- Crypto
