
Bearish technical signals persist — Bit Digital stock slips 3.01%

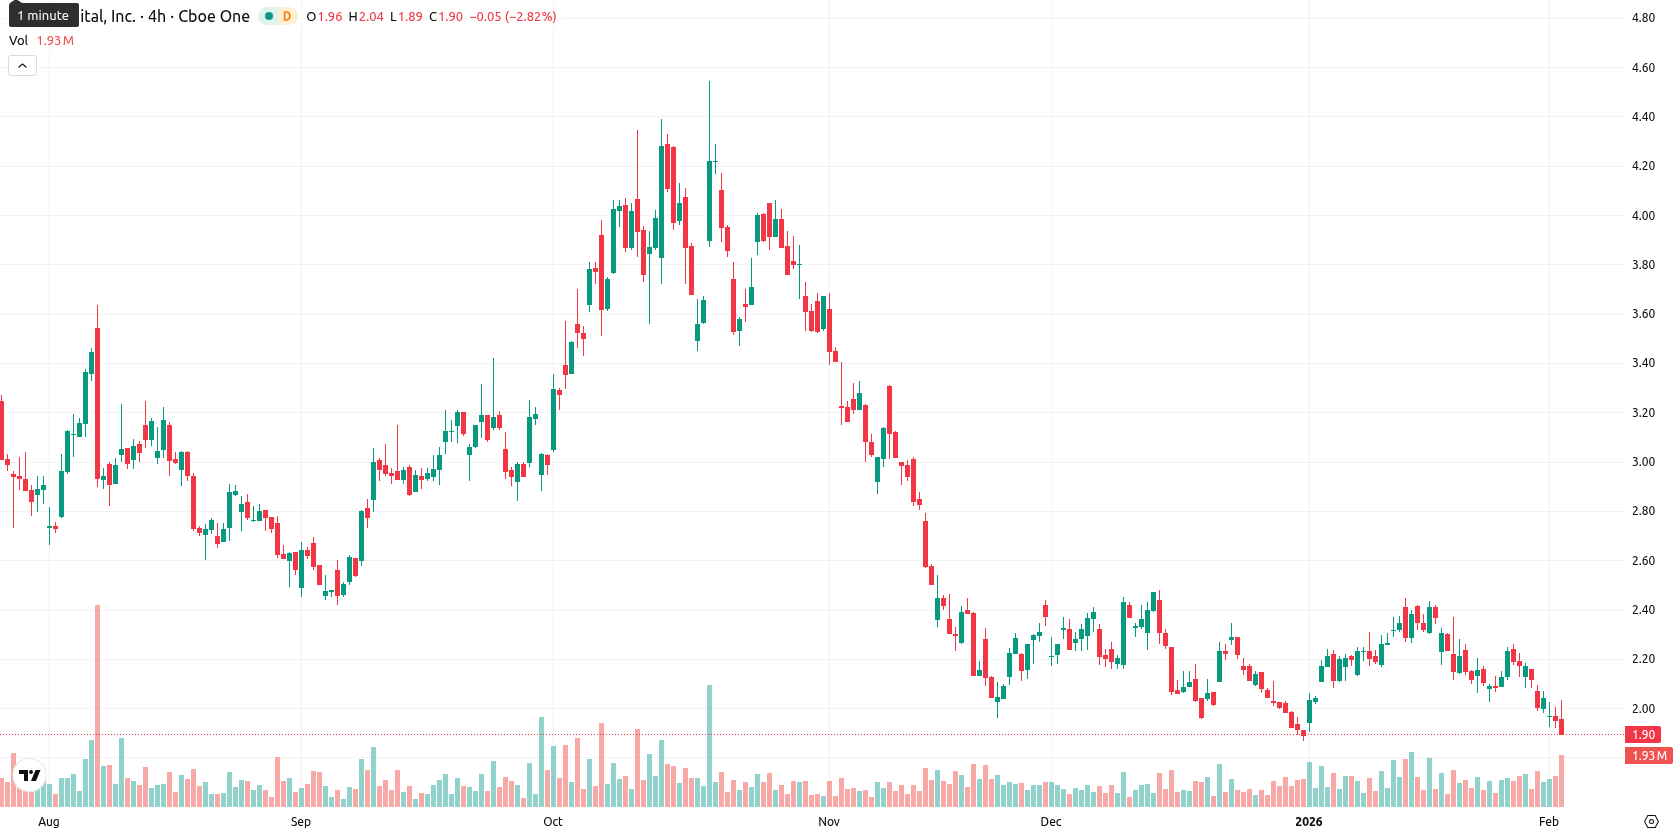
Bit Digital Inc (BTBT) is trading at $1.88, marking a daily decline of 3.01%. The price remains below the MA-20 ($2.19), MA-50 ($2.19), and MA-200 ($2.70), reflecting sustained downward momentum across all major timeframes.
Highlights
- BTBT is trading at $1.88, below its MA-20 ($2.19), MA-50 ($2.19), and MA-200 ($2.70), confirming persistent multi-timeframe downward pressure.
- Momentum remains weak with a bearish MACD, low ADX, and multiple oversold signals (RSI 37.28, Stochastic RSI 0.00, CCI –198.60), supporting continued bearish sentiment.
- The next five-day range is forecast at $1.75 to $2.05, with more than 80% probability of further declines unless price decisively breaks above the $2.16 resistance.
Persistent bearish momentum as oversold signals fail to draw buyers
Momentum remains weak, as signaled by a bearish MACD and a low ADX, confirming lack of conviction behind any upward move. Oversold conditions are apparent on the RSI (37.28), Stochastic RSI (0.00), and CCI (–198.60), but sellers continue to dominate according to Bull/Bear Power. The Awesome Oscillator also confirms ongoing selling pressure. The share slipped 3.01% on the day without a material opening gap, and the price is currently hovering near today’s intraday low, indicating moderate volatility and sustained pressure after the open. All core momentum and oscillator signals consistently point to persistent bearish sentiment with no notable divergence.
High probability of decline as bearish trend dominates near-term outlook
Looking ahead, the expected price range for the next five trading days is $1.75 to $2.05, reflecting a volatility band relative to current levels. The probability of further decline remains very high (more than 80%), while an upward reversal appears unlikely. In the baseline scenario, the price stabilizes between $1.75 and $2.05. A bullish scenario would require a decisive move above the $2.16 resistance, while a bearish scenario could see the price slip below $1.75 if selling pressure intensifies further. Overall, momentum and trend signals strongly favor continued bearishness in the near term.
Previously it was reported that Bit Digital Inc. trades below key moving averages, with the current price lagging beneath short-, medium-, and long-term averages, while dynamic resistance remains near $2.16 and support is set around $1.90. Broad-based selling pressure is confirmed by oversold oscillator and momentum signals, suggesting further downside risk unless a move above resistance occurs.


Latest Bit Digital News


-
 Afghanistan
-
 Albania
-
 Algeria
-
 Angola
-
 Argentina
-
 Armenia
-
 Australia
-
 Austria
-
 Azerbaijan
-
 Bahamas
-
 Bahrain
-
 Bangladesh
-
 Belarus
-
 Belgium
-
 Bolivia
-
 Botswana
-
 Brazil
-
 Brunei
-
 Bulgaria
-
 Cambodia
-
 Cameroon
-
 Canada
-
 Chile
Chile
-
 China
China
-
 Colombia
-
 Congo
Congo
-
 Costa Rica
-
 Cote d'Ivoire
-
 Croatia
-
 Cuba
Cuba
-
 Cyprus
-
 Czechia
-
 DR Congo
-
 Denmark
-
 Dominican Republic
-
 Ecuador
-
 Egypt
Egypt
-
 El Salvador
-
 Estonia
-
 Eswatini
-
 Ethiopia
-
 Finland
-
 France
-
 Georgia
-
 Germany
-
 Ghana
Ghana
-
 Greece
-
 Haiti
Haiti
-
 Hong Kong
-
 Hungary
-
 India
India
-
 Indonesia
-
 Iran, Islamic republic
-
 Iraq
Iraq
-
 Ireland
-
 Israel
-
 Italy
Italy
-
 Jamaica
-
 Japan
Japan
-
 Jordan
-
 Kazakhstan
-
 Kenya
Kenya
-
 Korea
Korea
-
 Kuwait
-
 Kyrgyzstan
-
 Laos
Laos
-
 Latvia
-
 Lebanon
-
 Lesotho
-
 Libya
Libya
-
 Lithuania
-
 Luxembourg
-
 Madagascar
-
 Malaysia
-
 Malta
Malta
-
 Mauritius
-
 Mexico
-
 Moldova
-
 Mongolia
-
 Montenegro
-
 Morocco
-
 Mozambique
-
 Myanmar
-
 Namibia
-
 Nepal
Nepal
-
 Netherlands
-
 New Zealand
-
 Nigeria
-
 North Macedonia
-
 Norway
-
 Oman
Oman
-
 Pakistan
-
 Palestine
-
 Panama
-
 Papua New Guinea
-
 Paraguay
-
 Peru
Peru
-
 Philippines
-
 Poland
-
 Portugal
-
 Puerto Rico
-
 Qatar
Qatar
-
 Reunion
-
 Romania
-
 Rwanda
-
 Saudi Arabia
-
 Serbia
-
 Singapore
-
 Slovakia
-
 Slovenia
-
 Somalia
-
 South Africa
-
 Spain
Spain
-
 Sri Lanka
-
 Sweden
-
 Switzerland
-
 Syria
Syria
-
 Taiwan
-
 Tajikistan
-
 Tanzania
-
 Thailand
-
 Trinidad and Tobago
-
 Tunisia
-
 Turkey
-
 UAE
UAE
-
 Uganda
-
 Ukraine
-
 United Kingdom
-
United States
-
 Uruguay
-
 Uzbekistan
-
 Venezuela
-
 Vietnam
-
 Yemen
Yemen
-
 Zambia
-
 Zimbabwe
- Forex
- Crypto
