
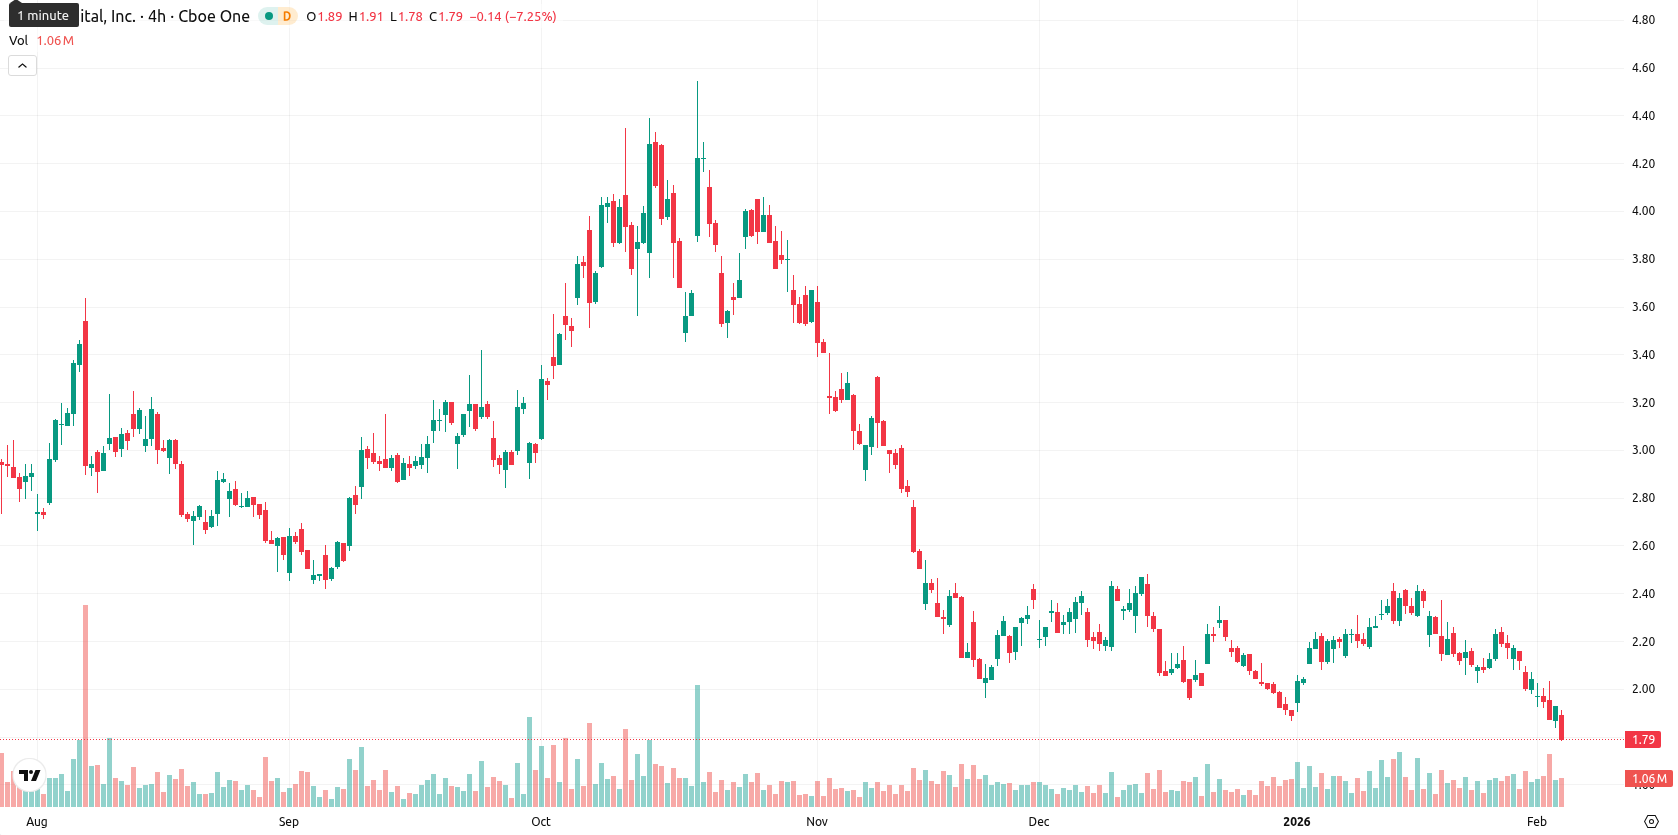
Bit Digital stock price forecast: Support at $1.70 in focus as BTBT falls 6.74%

Bit Digital Inc (BTBT) is trading at $1.80 after a sharp 6.74% decline and remains well below its MA-20 ($2.18), MA-50 ($2.18), and MA-200 ($2.70), highlighting continued downward pressure in all major timeframes. The asset is currently sitting far below the Ichimoku Kijun resistance at $2.14, with $1.78 appearing as near-term support based on today's intraday lows.
Highlights
- BTBT trades at $1.80, significantly below its MA-20, MA-50 ($2.18), and MA-200 ($2.70), signaling pronounced downward pressure across all major timeframes.
- Bearish momentum dominates, with declining MACD, weak trend from ADX, oversold RSI near 37, and key oscillators aligning on further downside.
- Near-term support is at $1.78 with resistance at $1.95 and $2.14 (Ichimoku Kijun), and the expected five-day range is $1.70–$1.95 unless support fails.
Oversold signals deepen as indicators confirm persistent seller control
Momentum indicators are firmly bearish: the MACD continues to decline, the ADX signals a weak trend, and the RSI has dropped to 37. A zero-value Stochastic RSI and a sharply negative CCI both reinforce the oversold status, while persistent seller dominance is confirmed by Bull/Bear Power. The Awesome Oscillator trend also points lower. Today’s session has seen high volatility and unrelenting downside pressure, with BTBT trading near its intraday low. All main momentum and oscillator readings are aligned, reflecting a negative tone and showing no bullish divergences.
Sideways or lower bias as rebound risks remain subdued
Looking to the next five trading days, the expected price range is $1.70 to $1.95, reflecting typical volatility relative to current levels. All higher-timeframe signals — including MA-50, MACD, RSI, and ADX on the weekly chart — point to continued weakness, implying less than a 20% chance of a meaningful price rebound. The baseline scenario is sideways action between $1.70 and $1.95; a sustained move above $1.95 and the $2.14 Kijun would be needed for a bullish setup, while a break below $1.70 could accelerate further downside if near-term support gives way.
Currently, Bit Digital Inc. (BTBT) trades well below its short-, medium-, and long-term moving averages, with persistent bearish momentum underscored by weak MACD and ADX readings and a lack of immediate support below the current price. Oversold conditions are highlighted by low RSI and Stochastic levels, yet intraday indicators and resistance at $2.14 suggest sellers remain in control despite the potential for a technical rebound.


Latest Bit Digital News


-
 Afghanistan
-
 Albania
-
 Algeria
-
 Angola
-
 Argentina
-
 Armenia
-
 Australia
-
 Austria
-
 Azerbaijan
-
 Bahamas
-
 Bahrain
-
 Bangladesh
-
 Belarus
-
 Belgium
-
 Bolivia
-
 Botswana
-
 Brazil
-
 Brunei
-
 Bulgaria
-
 Cambodia
-
 Cameroon
-
 Canada
-
 Chile
Chile
-
 China
China
-
 Colombia
-
 Congo
Congo
-
 Costa Rica
-
 Cote d'Ivoire
-
 Croatia
-
 Cuba
Cuba
-
 Cyprus
-
 Czechia
-
 DR Congo
-
 Denmark
-
 Dominican Republic
-
 Ecuador
-
 Egypt
Egypt
-
 El Salvador
-
 Estonia
-
 Eswatini
-
 Ethiopia
-
 Finland
-
 France
-
 Georgia
-
 Germany
-
 Ghana
Ghana
-
 Greece
-
 Haiti
Haiti
-
 Hong Kong
-
 Hungary
-
 India
India
-
 Indonesia
-
 Iran, Islamic republic
-
 Iraq
Iraq
-
 Ireland
-
 Israel
-
 Italy
Italy
-
 Jamaica
-
 Japan
Japan
-
 Jordan
-
 Kazakhstan
-
 Kenya
Kenya
-
 Korea
Korea
-
 Kuwait
-
 Kyrgyzstan
-
 Laos
Laos
-
 Latvia
-
 Lebanon
-
 Lesotho
-
 Libya
Libya
-
 Lithuania
-
 Luxembourg
-
 Madagascar
-
 Malaysia
-
 Malta
Malta
-
 Mauritius
-
 Mexico
-
 Moldova
-
 Mongolia
-
 Montenegro
-
 Morocco
-
 Mozambique
-
 Myanmar
-
 Namibia
-
 Nepal
Nepal
-
 Netherlands
-
 New Zealand
-
 Nigeria
-
 North Macedonia
-
 Norway
-
 Oman
Oman
-
 Pakistan
-
 Palestine
-
 Panama
-
 Papua New Guinea
-
 Paraguay
-
 Peru
Peru
-
 Philippines
-
 Poland
-
 Portugal
-
 Puerto Rico
-
 Qatar
Qatar
-
 Reunion
-
 Romania
-
 Rwanda
-
 Saudi Arabia
-
 Serbia
-
 Singapore
-
 Slovakia
-
 Slovenia
-
 Somalia
-
 South Africa
-
 Spain
Spain
-
 Sri Lanka
-
 Sweden
-
 Switzerland
-
 Syria
Syria
-
 Taiwan
-
 Tajikistan
-
 Tanzania
-
 Thailand
-
 Trinidad and Tobago
-
 Tunisia
-
 Turkey
-
 UAE
UAE
-
 Uganda
-
 Ukraine
-
 United Kingdom
-
United States
-
 Uruguay
-
 Uzbekistan
-
 Venezuela
-
 Vietnam
-
 Yemen
Yemen
-
 Zambia
-
 Zimbabwe
- Forex
- Crypto
