
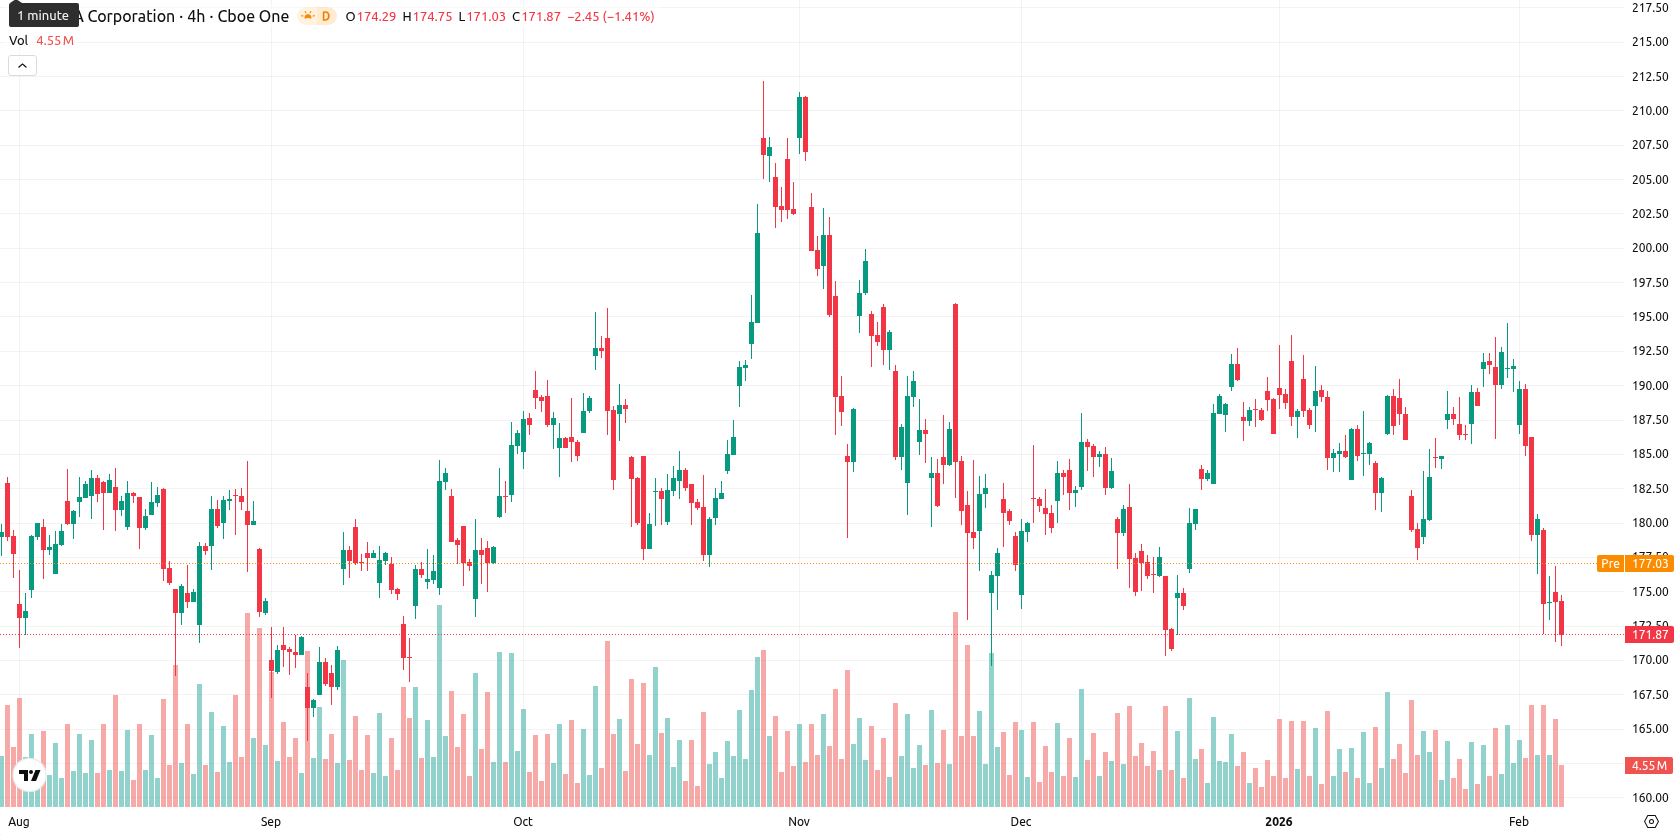
Nvidia stock drops 1.23% as bearish momentum persists and sellers dominate short-term trading

NVIDIA Corporation (NVDA) is trading at $172.06, placing the price well below the MA-20 ($184.68) and MA-50 ($183.51) but still above the MA-200 ($169.24), which indicates sustained short- and medium-term bearish pressure while long-term support remains intact.
Highlights
- Nvidia faces challenges in China’s data center market due to US-China restrictions, while pursuing major AI investments like a $2 billion CoreWeave commitment.
- Ongoing industry demand for AI hardware and maintenance of trust bolster Nvidia’s position, as both it and OpenAI deny partnership tensions around a reported $20 billion stake.
- NVDA trades at $172.06, below MA-20 ($184.68) and MA-50 ($183.51) but above MA-200 ($169.24), with strong short-term bearish momentum and oversold technical signals.
Ongoing headwinds offset by AI investments and resilient market demand
Nvidia's recent performance reflects ongoing company initiatives and operational headwinds. The company has confirmed challenges in competing in China’s data center market due to US-China restrictions, alongside major investments such as a $2 billion commitment to CoreWeave for AI infrastructure and reported negotiations around a $20 billion stake in OpenAI, though both Nvidia and OpenAI have denied any partnership strain. Robust demand for AI hardware and ongoing industry trust remain supportive secondary factors.
Oversold technical signals as resistance holds and momentum wanes
The nearest dynamic resistance is defined by the Ichimoku Kijun at $182.78, with MA-200 at $169.24 acting as dynamic support; the absence of a death or golden cross confirms there is no major long-term trend signal triggered at this time. Momentum signals are weak, with the MACD on D1 showing a neutral picture and the ADX indicating a lack of strong directional movement. Oscillator readings reflect clear oversold conditions: RSI sits at 34.45, Stochastic RSI is fully oversold, and CCI is at -215.98. Sellers dominate short-term action according to Bull/Bear Power, which is firmly in the oversold range.
Further downside likely as bullish reversal faces major resistance
In the upcoming five trading days, the expected price range for NVDA is $169.80 to $172.90, representing a typical volatility band relative to current levels. The probability of a price increase is very low (less than 20%), so further declines are likely. The baseline scenario calls for price stabilization in a narrow, sideways corridor just above $170, while a sustained move above the Ichimoku Kijun and MA-50 ($182.78–$183.51) would be needed to spark a bullish recovery. A bearish break below the MA-200 ($169.24) would suggest additional downside risk.
Last time, analysts noted that Nvidia remains in a corrective phase within a long-term uptrend, trading below key moving averages and facing resistance near the $185–190 zone with a daily RSI in the low-40s indicating there is still room for further downside. Immediate support is seen at $170, with additional support at $164–165, while the stock is expected to remain range-bound ahead of earnings as investors await a clear catalyst.


-
 Afghanistan
-
 Albania
-
 Algeria
-
 Angola
-
 Argentina
-
 Armenia
-
 Australia
-
 Austria
-
 Azerbaijan
-
 Bahamas
-
 Bahrain
-
 Bangladesh
-
 Belarus
-
 Belgium
-
 Bolivia
-
 Botswana
-
 Brazil
-
 Brunei
-
 Bulgaria
-
 Cambodia
-
 Cameroon
-
 Canada
-
 Chile
Chile
-
 China
China
-
 Colombia
-
 Congo
Congo
-
 Costa Rica
-
 Cote d'Ivoire
-
 Croatia
-
 Cuba
Cuba
-
 Cyprus
-
 Czechia
-
 DR Congo
-
 Denmark
-
 Dominican Republic
-
 Ecuador
-
 Egypt
Egypt
-
 El Salvador
-
 Estonia
-
 Eswatini
-
 Ethiopia
-
 Finland
-
 France
-
 Georgia
-
 Germany
-
 Ghana
Ghana
-
 Greece
-
 Haiti
Haiti
-
 Hong Kong
-
 Hungary
-
 India
India
-
 Indonesia
-
 Iran, Islamic republic
-
 Iraq
Iraq
-
 Ireland
-
 Israel
-
 Italy
Italy
-
 Jamaica
-
 Japan
Japan
-
 Jordan
-
 Kazakhstan
-
 Kenya
Kenya
-
 Korea
Korea
-
 Kuwait
-
 Kyrgyzstan
-
 Laos
Laos
-
 Latvia
-
 Lebanon
-
 Lesotho
-
 Libya
Libya
-
 Lithuania
-
 Luxembourg
-
 Madagascar
-
 Malaysia
-
 Malta
Malta
-
 Mauritius
-
 Mexico
-
 Moldova
-
 Mongolia
-
 Montenegro
-
 Morocco
-
 Mozambique
-
 Myanmar
-
 Namibia
-
 Nepal
Nepal
-
 Netherlands
-
 New Zealand
-
 Nigeria
-
 North Macedonia
-
 Norway
-
 Oman
Oman
-
 Pakistan
-
 Palestine
-
 Panama
-
 Papua New Guinea
-
 Paraguay
-
 Peru
Peru
-
 Philippines
-
 Poland
-
 Portugal
-
 Puerto Rico
-
 Qatar
Qatar
-
 Reunion
-
 Romania
-
 Rwanda
-
 Saudi Arabia
-
 Serbia
-
 Singapore
-
 Slovakia
-
 Slovenia
-
 Somalia
-
 South Africa
-
 Spain
Spain
-
 Sri Lanka
-
 Sweden
-
 Switzerland
-
 Syria
Syria
-
 Taiwan
-
 Tajikistan
-
 Tanzania
-
 Thailand
-
 Trinidad and Tobago
-
 Tunisia
-
 Turkey
-
 UAE
UAE
-
 Uganda
-
 Ukraine
-
 United Kingdom
-
United States
-
 Uruguay
-
 Uzbekistan
-
 Venezuela
-
 Vietnam
-
 Yemen
Yemen
-
 Zambia
-
 Zimbabwe
- Forex
- Crypto
