
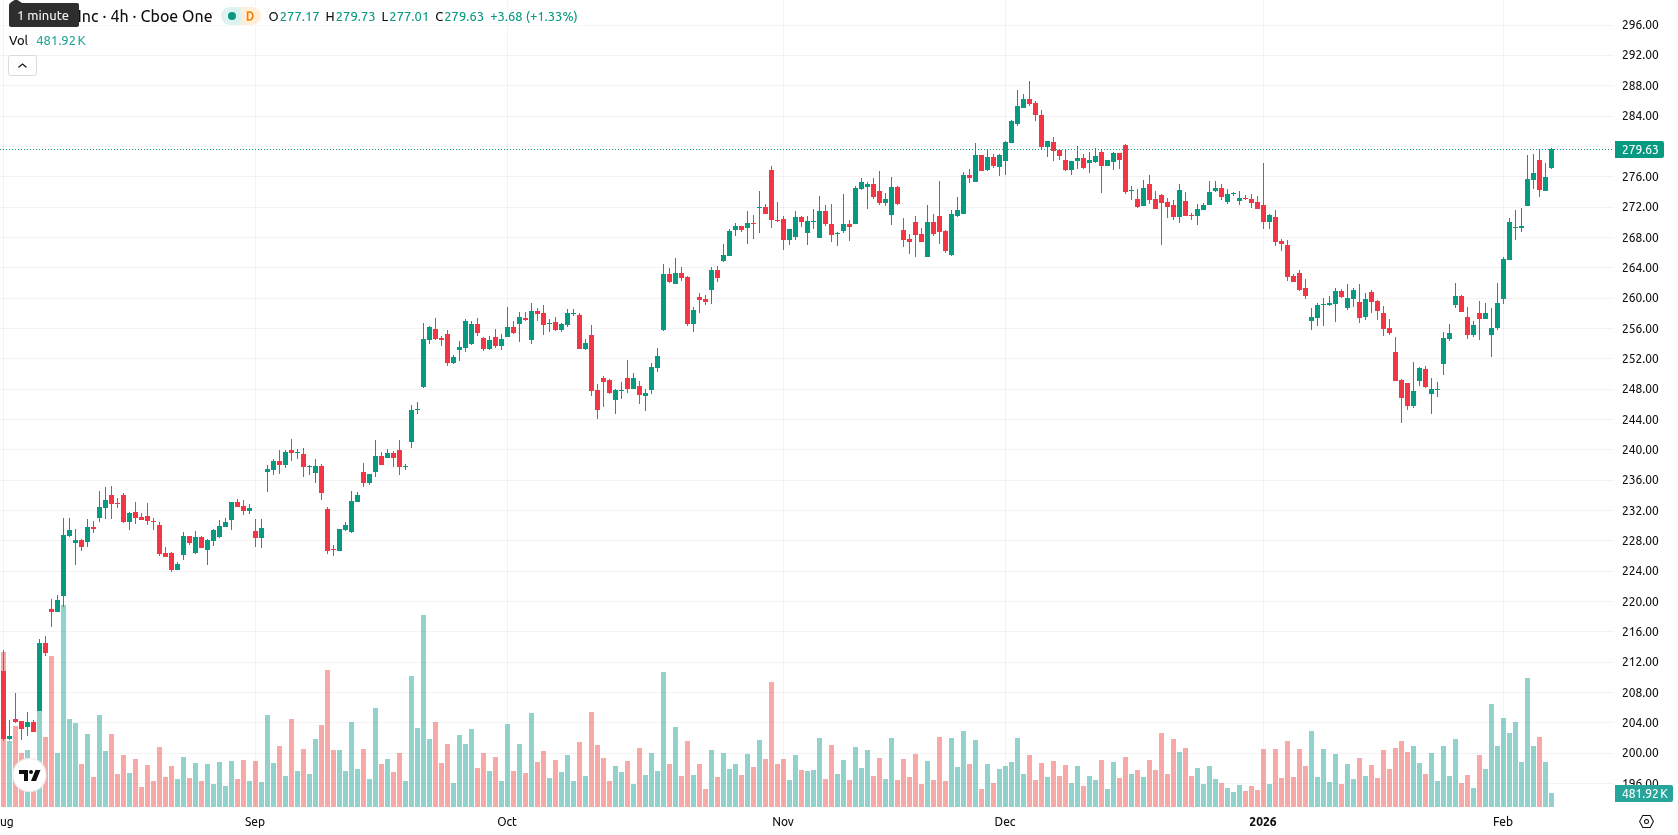
+1.35% for Apple stock — buyers remain dominant after upbeat results and nearly $4T market cap

Apple Inc. (AAPL) is trading at $279.83, well above the MA-20 ($259.21), MA-50 ($268.66), and MA-200 ($238.18), which confirms strong short-, medium-, and long-term uptrends.
Highlights
- Apple's Q1 2026 revenue reached $143.8 billion with net income of $42.1 billion and EPS of $2.84, exceeding expectations.
- iPhone sales hit $85.3 billion, driven by 38% year-over-year growth in China, and the board declared a $0.26 per share dividend payable February 12.
- AAPL trades at $279.83, with technical support at $268.66 (MA-50) and expected to range between $270–$285 over the next week amid overbought conditions.
Record China sales and upbeat earnings drive market cap surge
Apple reported strong first-quarter 2026 results, with revenue at $143.8 billion and net income of $42.1 billion, as EPS of $2.84 beat expectations. iPhone sales achieved record levels at $85.3 billion, highlighted by 38% year-over-year growth in China. The board declared a quarterly cash dividend of $0.26 per share, with payout scheduled for February 12, and market capitalization is nearing $4 trillion.
Overbought signals and upward ADX as buyers dominate near resistance
The nearest dynamic support is indicated by the Ichimoku Kijun at $261.19, while MA-50 ($268.66) now acts as a support and the next major resistance is likely to be a round figure near $280. Momentum is positive, with the MACD remaining neutral but the ADX trending upward, confirming buyer strength. Multiple oscillators, including RSI and Commodity Channel Index, show overbought conditions, while Bull/Bear Power is elevated, indicating continued dominance by buyers intraday. Today opened with a small upward gap (previous close $276.11; open $278.39), and price action is currently at the high end of today’s range ($277.25 — $278.69) with low volatility and pronounced strength toward the highs. Overbought readings on the Stochastic RSI and mixed signals from the oscillators highlight a divergence between persistent momentum and the risk of short-term pullback.
Consolidation in high-probability range as breakout and reversal risks diverge
For the next five trading days, the expected price range is $270 to $285, reflecting a typical volatility band relative to current levels. The probability of a price increase remains high (over 80%), while the risk of a decline is much lower. In the baseline scenario, AAPL is likely to consolidate within $270 — $285 as the market digests recent strength. A bullish breakout above $285 could see buyers push higher toward psychological milestones, while a bearish reversal below $270 would expose the stock to corrective pressure toward support at $261.
Previously it was reported that Apple Inc. is exhibiting strong bullish momentum, trading well above key moving averages and approaching near-term resistance, with technical indicators showing persistent buying interest despite overbought conditions. However, oscillators signal stretched short-term levels and a likely period of sideways consolidation within a defined range, as breakout and reversal risks increase.


Latest Apple News


-
 Afghanistan
-
 Albania
-
 Algeria
-
 Angola
-
 Argentina
-
 Armenia
-
 Australia
-
 Austria
-
 Azerbaijan
-
 Bahamas
-
 Bahrain
-
 Bangladesh
-
 Belarus
-
 Belgium
-
 Bolivia
-
 Botswana
-
 Brazil
-
 Brunei
-
 Bulgaria
-
 Cambodia
-
 Cameroon
-
 Canada
-
 Chile
Chile
-
 China
China
-
 Colombia
-
 Congo
Congo
-
 Costa Rica
-
 Cote d'Ivoire
-
 Croatia
-
 Cuba
Cuba
-
 Cyprus
-
 Czechia
-
 DR Congo
-
 Denmark
-
 Dominican Republic
-
 Ecuador
-
 Egypt
Egypt
-
 El Salvador
-
 Estonia
-
 Eswatini
-
 Ethiopia
-
 Finland
-
 France
-
 Georgia
-
 Germany
-
 Ghana
Ghana
-
 Greece
-
 Haiti
Haiti
-
 Hong Kong
-
 Hungary
-
 India
India
-
 Indonesia
-
 Iran, Islamic republic
-
 Iraq
Iraq
-
 Ireland
-
 Israel
-
 Italy
Italy
-
 Jamaica
-
 Japan
Japan
-
 Jordan
-
 Kazakhstan
-
 Kenya
Kenya
-
 Korea
Korea
-
 Kuwait
-
 Kyrgyzstan
-
 Laos
Laos
-
 Latvia
-
 Lebanon
-
 Lesotho
-
 Libya
Libya
-
 Lithuania
-
 Luxembourg
-
 Madagascar
-
 Malaysia
-
 Malta
Malta
-
 Mauritius
-
 Mexico
-
 Moldova
-
 Mongolia
-
 Montenegro
-
 Morocco
-
 Mozambique
-
 Myanmar
-
 Namibia
-
 Nepal
Nepal
-
 Netherlands
-
 New Zealand
-
 Nigeria
-
 North Macedonia
-
 Norway
-
 Oman
Oman
-
 Pakistan
-
 Palestine
-
 Panama
-
 Papua New Guinea
-
 Paraguay
-
 Peru
Peru
-
 Philippines
-
 Poland
-
 Portugal
-
 Puerto Rico
-
 Qatar
Qatar
-
 Reunion
-
 Romania
-
 Rwanda
-
 Saudi Arabia
-
 Serbia
-
 Singapore
-
 Slovakia
-
 Slovenia
-
 Somalia
-
 South Africa
-
 Spain
Spain
-
 Sri Lanka
-
 Sweden
-
 Switzerland
-
 Syria
Syria
-
 Taiwan
-
 Tajikistan
-
 Tanzania
-
 Thailand
-
 Trinidad and Tobago
-
 Tunisia
-
 Turkey
-
 UAE
UAE
-
 Uganda
-
 Ukraine
-
 United Kingdom
-
United States
-
 Uruguay
-
 Uzbekistan
-
 Venezuela
-
 Vietnam
-
 Yemen
Yemen
-
 Zambia
-
 Zimbabwe
- Forex
- Crypto
