
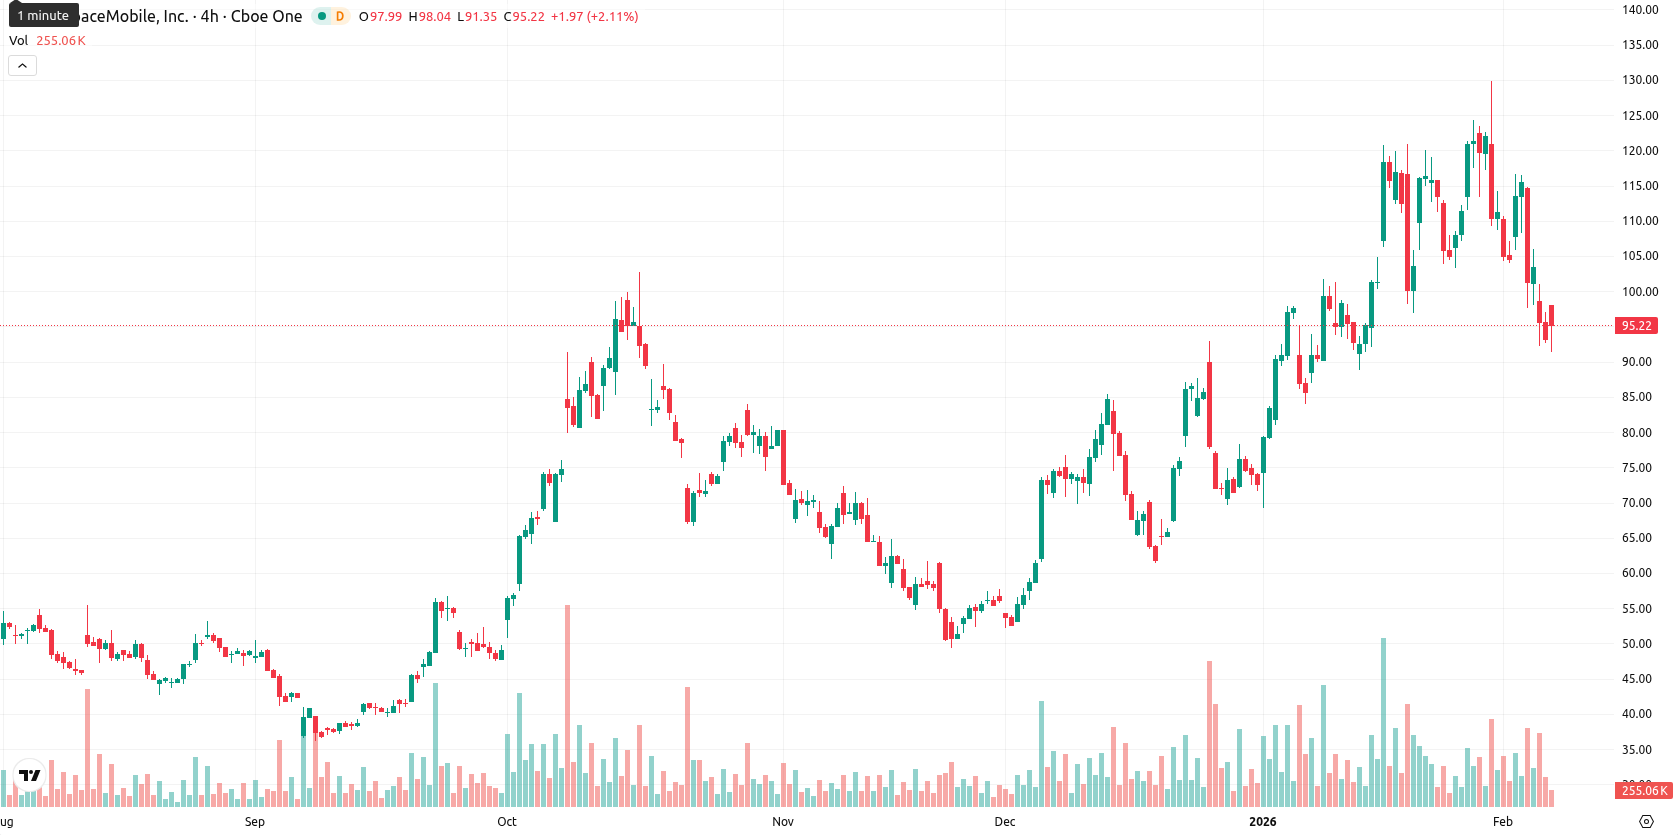
+4.02% for AST SpaceMobile stock — bullish trend holds above MA-50 support

AST SpaceMobile, Inc. (ASTS) is currently trading at $97.02, which places the price below the MA-20 ($106.26) but above the MA-50 ($85.82) and significantly above the MA-200 ($58.10). This setup indicates short-term pressure from sellers while the medium- and long-term trends remain bullish, with dynamic support from the MA-50 and nearby resistance at the Ichimoku Kijun level of $99.47.
Highlights
- Penserra Capital Management LLC raised its stake in AST SpaceMobile by 5.3% in Q3, signaling increased institutional interest per SEC filing.
- Defiance ETFs launched ASTN, enabling investors to take leveraged short positions against AST SpaceMobile's stock amid ongoing satellite network developments and operational challenges.
- ASTS trades at $97.02, facing short-term resistance at $99.47 and support at $95.00, with bullish medium-term technical signals and 80% probability of price increase.
Institutional interest rises while short products and partnerships expand
Penserra Capital Management LLC increased its stake in AST SpaceMobile by 5.3% in the third quarter, reflecting institutional interest in the company's future prospects according to a recent SEC filing. Meanwhile, the launch of ASTN by Defiance ETFs offers investors a new way to take leveraged short positions against AST SpaceMobile's stock. The company continues its work on a satellite-based cellular network, advancing through new contracts and partnerships despite operational challenges.
Oscillator divergence emerges as sellers dominate within mixed momentum
Momentum signals are mixed on the daily chart, with the MACD showing strong positive momentum but the RSI at 46.35 indicating no overbought conditions. The ADX value of 25.25 points to a modest emerging trend, while the Stochastic RSI and Bull/Bear Power suggest oversold conditions with sellers currently dominating. There is oscillator divergence, as the Commodity Channel Index leans bearish and the Awesome Oscillator remains neutral. After opening with a notable gap up, the price has eased but sits near the mid-range for the session, reflecting moderate intraday volatility and consolidation following the initial upward move.
Bullish probability high as price consolidates near key technical levels
Over the next five trading days, the typical volatility band is expected between $95.00 and $105.00, consistent with recent movements and within 10% of the current price. The probability of a price increase remains high (more than 80%), with a much lower chance of a sustained decline, based on strong buy signals from weekly moving averages and supporting indicators. In the main scenario, ASTS may consolidate within this corridor as the market awaits new catalysts. A break and close above $99.47 would signal a bullish move toward the upper end of the range, while a failure of support at $95.00 could lead to a test closer to the MA-50 near $85.82.
Previously it was reported that AST SpaceMobile is trading below its short-term moving average but remains comfortably above its medium- and long-term averages, indicating sustained structural strength despite short-term selling pressure. Momentum indicators are mixed, with the MACD signaling buying interest, while RSI, CCI, and other oscillators reflect short-term caution and oversold conditions as key support holds and resistance aligns near the MA-20.


Latest AST SpaceMobile News


-
 Afghanistan
-
 Albania
-
 Algeria
-
 Angola
-
 Argentina
-
 Armenia
-
 Australia
-
 Austria
-
 Azerbaijan
-
 Bahamas
-
 Bahrain
-
 Bangladesh
-
 Belarus
-
 Belgium
-
 Bolivia
-
 Botswana
-
 Brazil
-
 Brunei
-
 Bulgaria
-
 Cambodia
-
 Cameroon
-
 Canada
-
 Chile
Chile
-
 China
China
-
 Colombia
-
 Congo
Congo
-
 Costa Rica
-
 Cote d'Ivoire
-
 Croatia
-
 Cuba
Cuba
-
 Cyprus
-
 Czechia
-
 DR Congo
-
 Denmark
-
 Dominican Republic
-
 Ecuador
-
 Egypt
Egypt
-
 El Salvador
-
 Estonia
-
 Eswatini
-
 Ethiopia
-
 Finland
-
 France
-
 Georgia
-
 Germany
-
 Ghana
Ghana
-
 Greece
-
 Haiti
Haiti
-
 Hong Kong
-
 Hungary
-
 India
India
-
 Indonesia
-
 Iran, Islamic republic
-
 Iraq
Iraq
-
 Ireland
-
 Israel
-
 Italy
Italy
-
 Jamaica
-
 Japan
Japan
-
 Jordan
-
 Kazakhstan
-
 Kenya
Kenya
-
 Korea
Korea
-
 Kuwait
-
 Kyrgyzstan
-
 Laos
Laos
-
 Latvia
-
 Lebanon
-
 Lesotho
-
 Libya
Libya
-
 Lithuania
-
 Luxembourg
-
 Madagascar
-
 Malaysia
-
 Malta
Malta
-
 Mauritius
-
 Mexico
-
 Moldova
-
 Mongolia
-
 Montenegro
-
 Morocco
-
 Mozambique
-
 Myanmar
-
 Namibia
-
 Nepal
Nepal
-
 Netherlands
-
 New Zealand
-
 Nigeria
-
 North Macedonia
-
 Norway
-
 Oman
Oman
-
 Pakistan
-
 Palestine
-
 Panama
-
 Papua New Guinea
-
 Paraguay
-
 Peru
Peru
-
 Philippines
-
 Poland
-
 Portugal
-
 Puerto Rico
-
 Qatar
Qatar
-
 Reunion
-
 Romania
-
 Rwanda
-
 Saudi Arabia
-
 Serbia
-
 Singapore
-
 Slovakia
-
 Slovenia
-
 Somalia
-
 South Africa
-
 Spain
Spain
-
 Sri Lanka
-
 Sweden
-
 Switzerland
-
 Syria
Syria
-
 Taiwan
-
 Tajikistan
-
 Tanzania
-
 Thailand
-
 Trinidad and Tobago
-
 Tunisia
-
 Turkey
-
 UAE
UAE
-
 Uganda
-
 Ukraine
-
 United Kingdom
-
United States
-
 Uruguay
-
 Uzbekistan
-
 Venezuela
-
 Vietnam
-
 Yemen
Yemen
-
 Zambia
-
 Zimbabwe
- Forex
- Crypto
