
Hut 8 stock: Mixed momentum signals and research spotlight spark a 15.07% surge

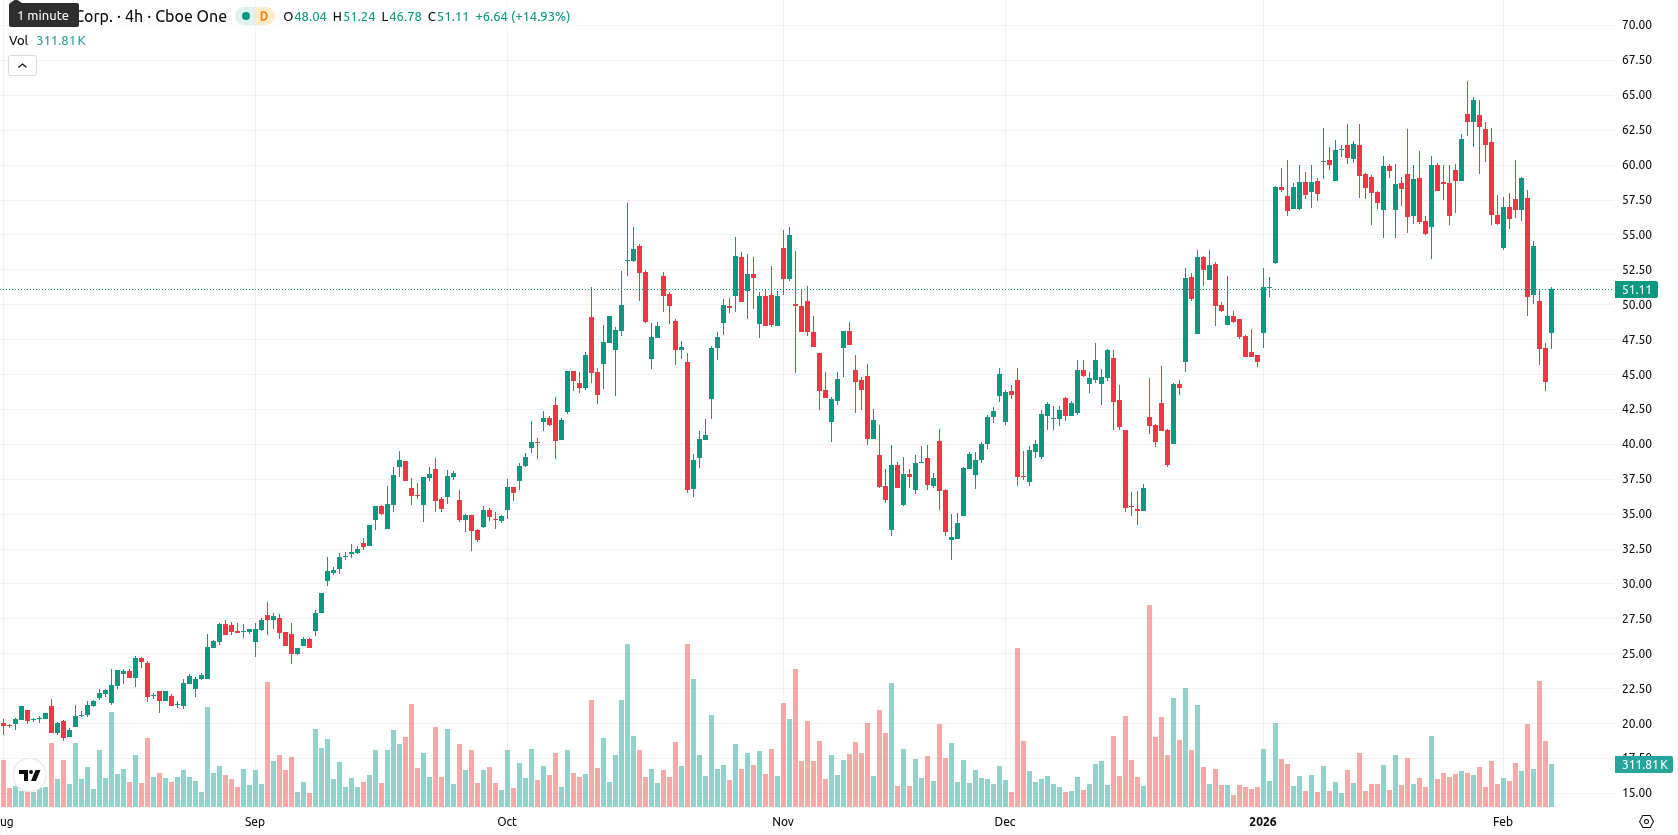
Hut 8 Corp (HUT) is trading at $51.19, which is below the MA-20 ($58.02) but just above the MA-50 ($50.46), indicating heavy short- and medium-term pressure from sellers while the price remains significantly higher than the MA-200 ($32.97), confirming longer-term structural support. The nearest dynamic resistance is now the Ichimoku Kijun at $54.96, with MA-50 likely acting as immediate support.
Highlights
- HC Wainwright's research on Hut 8 confirmed a healthy balance sheet with a quick ratio of 1.26, current ratio of 1.68, and a debt-to-equity ratio of 55.87.
- Hut 8's subsidiary, American Bitcoin Corp., is developing Bitcoin infrastructure platforms in the United States, expanding the company's operational footprint.
- HUT trades at $51.19, above MA-50 support ($50.46) but below Ichimoku Kijun resistance ($54.96); technicals project sideways movement in the $47–$55 range next week.
Balance sheet scrutiny intensifies after HC Wainwright research disclosure
Hut 8 has received attention following the release of a detailed research report by HC Wainwright outlining its financial position. The report confirmed key balance sheet metrics, including a quick ratio of 1.26, a current ratio of 1.68, and a debt-to-equity ratio of 55.87. Additional disclosures highlighted Hut 8's subsidiary, American Bitcoin Corp., which develops Bitcoin infrastructure platforms in the US.
Bullish price surge diverges from weak technical momentum signals
Momentum signals are mixed: the daily MACD is neutral and the ADX signals a weak trend, while RSI at 37.43 and the daily Commodity Channel Index deep in oversold territory suggest a possible short-term rebound. However, the Bull/Bear Power reading is strongly negative, indicating sellers still dominate intraday trading, despite the Stochastic RSI flagging oversold conditions. The session opened with a significant gap higher from $44.48 to $48.17, and the price surged 15.07% to $51.19, sitting right at the top of today’s range ($46.92–$51.02), reflecting very high intraday volatility and sustained buying pressure toward session highs. Price action strength today contrasts with weak momentum signals, highlighting a divergence between bullish price action and lagging oscillators.
Bullish consolidation expected as momentum supports limited downside
For the coming week, an adjusted price corridor for HUT is forecast between $47 and $55. The probability of further price increase is high — three out of four weekly momentum indicators (RSI, ADX, MACD, MA-50) show a strong bullish bias, giving more than 80% likelihood of continued gains, with downside risk seen as very low. The baseline scenario is sideways movement in the $47–$55 range as the market consolidates recent gains. A bullish scenario would see HUT break above $55, targeting resistance near the Ichimoku Kijun and establishing a push toward higher ground, while a bearish scenario could trigger if the price drops below $47, with MA-50 offering initial support and risk of a deeper retracement if momentum does not recover.
Previously it was reported that Hut 8 Corp. is trading below its short- and medium-term moving averages, indicating ongoing selling pressure, though it remains above the long-term average and faces dynamic resistance near $55. Despite a strong intraday rally, momentum indicators—including RSI and Stochastic RSI—highlight oversold conditions with weak trend strength, creating near-term uncertainty amid volatility.


Latest Hut 8 News


-
 Afghanistan
-
 Albania
-
 Algeria
-
 Angola
-
 Argentina
-
 Armenia
-
 Australia
-
 Austria
-
 Azerbaijan
-
 Bahamas
-
 Bahrain
-
 Bangladesh
-
 Belarus
-
 Belgium
-
 Bolivia
-
 Botswana
-
 Brazil
-
 Brunei
-
 Bulgaria
-
 Cambodia
-
 Cameroon
-
 Canada
-
 Chile
Chile
-
 China
China
-
 Colombia
-
 Congo
Congo
-
 Costa Rica
-
 Cote d'Ivoire
-
 Croatia
-
 Cuba
Cuba
-
 Cyprus
-
 Czechia
-
 DR Congo
-
 Denmark
-
 Dominican Republic
-
 Ecuador
-
 Egypt
Egypt
-
 El Salvador
-
 Estonia
-
 Eswatini
-
 Ethiopia
-
 Finland
-
 France
-
 Georgia
-
 Germany
-
 Ghana
Ghana
-
 Greece
-
 Haiti
Haiti
-
 Hong Kong
-
 Hungary
-
 India
India
-
 Indonesia
-
 Iran, Islamic republic
-
 Iraq
Iraq
-
 Ireland
-
 Israel
-
 Italy
Italy
-
 Jamaica
-
 Japan
Japan
-
 Jordan
-
 Kazakhstan
-
 Kenya
Kenya
-
 Korea
Korea
-
 Kuwait
-
 Kyrgyzstan
-
 Laos
Laos
-
 Latvia
-
 Lebanon
-
 Lesotho
-
 Libya
Libya
-
 Lithuania
-
 Luxembourg
-
 Madagascar
-
 Malaysia
-
 Malta
Malta
-
 Mauritius
-
 Mexico
-
 Moldova
-
 Mongolia
-
 Montenegro
-
 Morocco
-
 Mozambique
-
 Myanmar
-
 Namibia
-
 Nepal
Nepal
-
 Netherlands
-
 New Zealand
-
 Nigeria
-
 North Macedonia
-
 Norway
-
 Oman
Oman
-
 Pakistan
-
 Palestine
-
 Panama
-
 Papua New Guinea
-
 Paraguay
-
 Peru
Peru
-
 Philippines
-
 Poland
-
 Portugal
-
 Puerto Rico
-
 Qatar
Qatar
-
 Reunion
-
 Romania
-
 Rwanda
-
 Saudi Arabia
-
 Serbia
-
 Singapore
-
 Slovakia
-
 Slovenia
-
 Somalia
-
 South Africa
-
 Spain
Spain
-
 Sri Lanka
-
 Sweden
-
 Switzerland
-
 Syria
Syria
-
 Taiwan
-
 Tajikistan
-
 Tanzania
-
 Thailand
-
 Trinidad and Tobago
-
 Tunisia
-
 Turkey
-
 UAE
UAE
-
 Uganda
-
 Ukraine
-
 United Kingdom
-
United States
-
 Uruguay
-
 Uzbekistan
-
 Venezuela
-
 Vietnam
-
 Yemen
Yemen
-
 Zambia
-
 Zimbabwe
- Forex
- Crypto
