
AST SpaceMobile stock gains 3.71% as strong buy signals and high volatility boost momentum

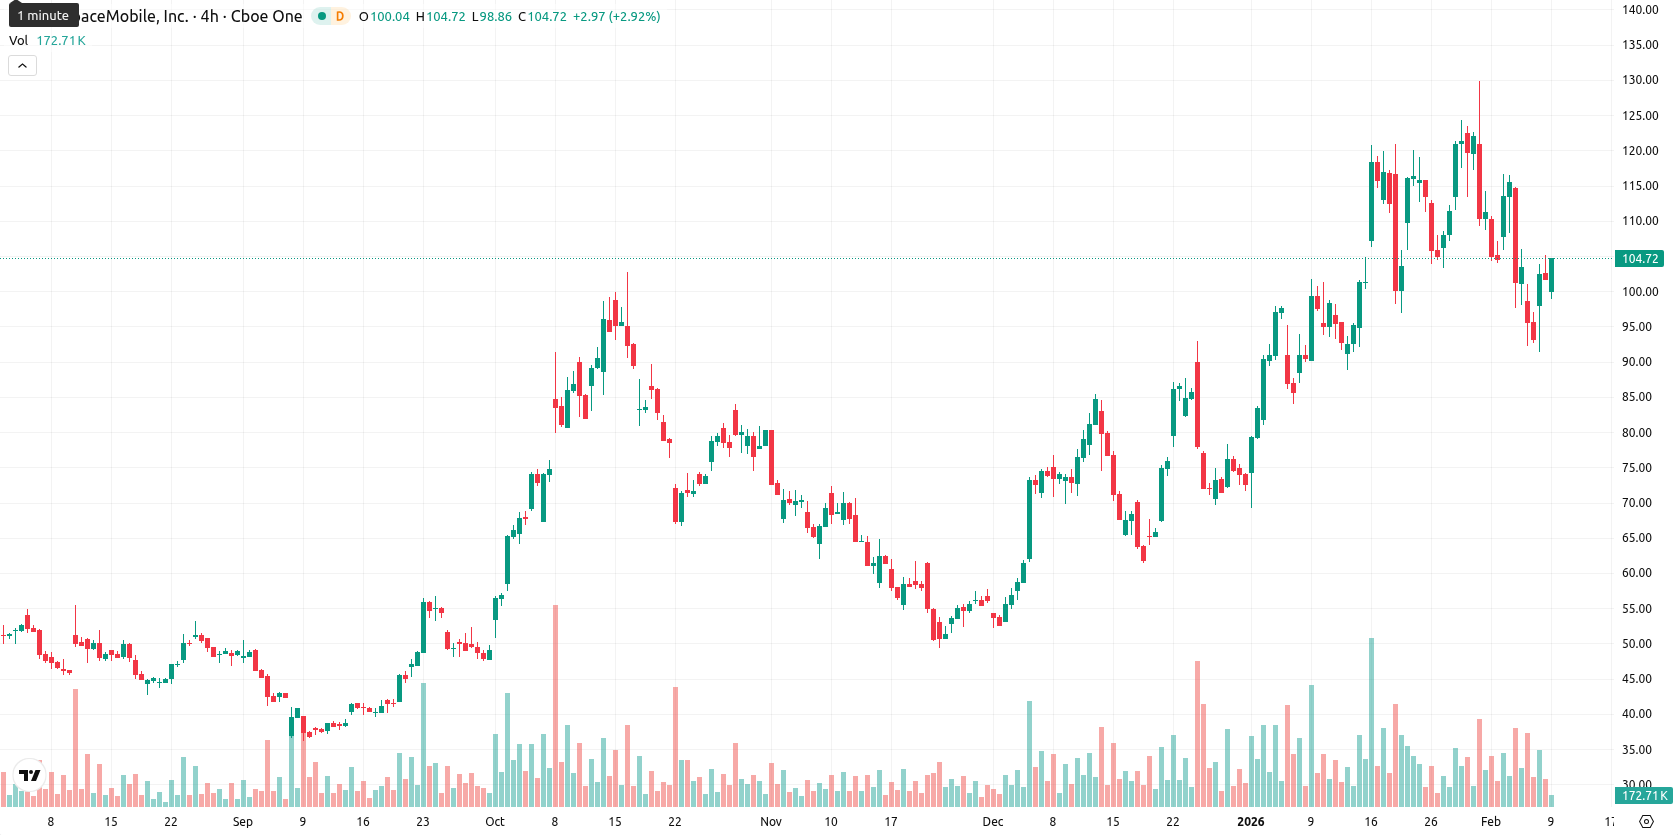
AST SpaceMobile, Inc. (ASTS) is trading at $105.56, posting a $3.77 gain (3.71%) on the day. The price is just below the MA-20 at $106.82, while remaining well above the MA-50 ($86.76) and MA-200 ($58.50), implying mild short-term resistance but a robust medium- and long-term positive structure.
Highlights
- ASTS is trading at $105.56, just below its MA-20 ($106.82) but well above MA-50 ($86.76) and MA-200 ($58.50), confirming a strong bullish medium- and long-term structure.
- Momentum metrics remain positive, with MACD flashing a strong buy, daily and weekly ADX confirming the uptrend, and RSI at a neutral-to-bullish 50.69.
- Key support lies at the Ichimoku Kijun ($99.47), consolidation is likely between $100–$110, and a breakout above $110 could target $115 over the next five trading days.
Momentum signals diverge as volatility and late-session buying increase
The Ichimoku Kijun offers dynamic support at $99.47, with the nearest resistance at the MA-20 and then the round figure of $110. The MACD remains on a strong buy signal and the ADX confirms trend continuation on both daily and weekly timeframes. RSI is neutral-to-bullish at 50.69; the Stochastic RSI gives a strong buy, CCI indicates a sell, while Bull/Bear Power suggests the market is oversold and that sellers dominated earlier. Today’s session was characterized by high intraday volatility and closing strength near the day’s high, despite some oscillator divergence.
High probability of upside as technicals favor consolidation
Over the next five trading days, ASTS is expected to move within a $100.00 – $115.00 band, reflecting typical volatility relative to current levels. Major weekly indicators such as RSI, ADX, MACD, and MA-50 all point to a very high chance (over 80%) of further upside, with a downside move considered unlikely. The baseline scenario anticipates sideways consolidation between $100 and $110, while an upside break could target $115; dropping below $100 would signal a bearish shift with support likely tested near the Ichimoku Kijun.
Last time, analysts noted that AST SpaceMobile Inc. is facing short-term bearish pressure as it trades below its 20-day moving average but maintains bullish medium- and long-term trends above its 50- and 200-day moving averages. Momentum indicators are mixed, with a bullish MACD contrasting against oversold oscillators and neutral RSI, while the stock trades amid heightened volatility between established support and resistance zones.


Latest AST SpaceMobile News


-
 Afghanistan
-
 Albania
-
 Algeria
-
 Angola
-
 Argentina
-
 Armenia
-
 Australia
-
 Austria
-
 Azerbaijan
-
 Bahamas
-
 Bahrain
-
 Bangladesh
-
 Belarus
-
 Belgium
-
 Bolivia
-
 Botswana
-
 Brazil
-
 Brunei
-
 Bulgaria
-
 Cambodia
-
 Cameroon
-
 Canada
-
 Chile
Chile
-
 China
China
-
 Colombia
-
 Congo
Congo
-
 Costa Rica
-
 Cote d'Ivoire
-
 Croatia
-
 Cuba
Cuba
-
 Cyprus
-
 Czechia
-
 DR Congo
-
 Denmark
-
 Dominican Republic
-
 Ecuador
-
 Egypt
Egypt
-
 El Salvador
-
 Estonia
-
 Eswatini
-
 Ethiopia
-
 Finland
-
 France
-
 Georgia
-
 Germany
-
 Ghana
Ghana
-
 Greece
-
 Haiti
Haiti
-
 Hong Kong
-
 Hungary
-
 India
India
-
 Indonesia
-
 Iran, Islamic republic
-
 Iraq
Iraq
-
 Ireland
-
 Israel
-
 Italy
Italy
-
 Jamaica
-
 Japan
Japan
-
 Jordan
-
 Kazakhstan
-
 Kenya
Kenya
-
 Korea
Korea
-
 Kuwait
-
 Kyrgyzstan
-
 Laos
Laos
-
 Latvia
-
 Lebanon
-
 Lesotho
-
 Libya
Libya
-
 Lithuania
-
 Luxembourg
-
 Madagascar
-
 Malaysia
-
 Malta
Malta
-
 Mauritius
-
 Mexico
-
 Moldova
-
 Mongolia
-
 Montenegro
-
 Morocco
-
 Mozambique
-
 Myanmar
-
 Namibia
-
 Nepal
Nepal
-
 Netherlands
-
 New Zealand
-
 Nigeria
-
 North Macedonia
-
 Norway
-
 Oman
Oman
-
 Pakistan
-
 Palestine
-
 Panama
-
 Papua New Guinea
-
 Paraguay
-
 Peru
Peru
-
 Philippines
-
 Poland
-
 Portugal
-
 Puerto Rico
-
 Qatar
Qatar
-
 Reunion
-
 Romania
-
 Rwanda
-
 Saudi Arabia
-
 Serbia
-
 Singapore
-
 Slovakia
-
 Slovenia
-
 Somalia
-
 South Africa
-
 Spain
Spain
-
 Sri Lanka
-
 Sweden
-
 Switzerland
-
 Syria
Syria
-
 Taiwan
-
 Tajikistan
-
 Tanzania
-
 Thailand
-
 Trinidad and Tobago
-
 Tunisia
-
 Turkey
-
 UAE
UAE
-
 Uganda
-
 Ukraine
-
 United Kingdom
-
United States
-
 Uruguay
-
 Uzbekistan
-
 Venezuela
-
 Vietnam
-
 Yemen
Yemen
-
 Zambia
-
 Zimbabwe
- Forex
- Crypto
