
Canopy Growth stock rises 3.67% as price rebounds despite continued bearish trend signals

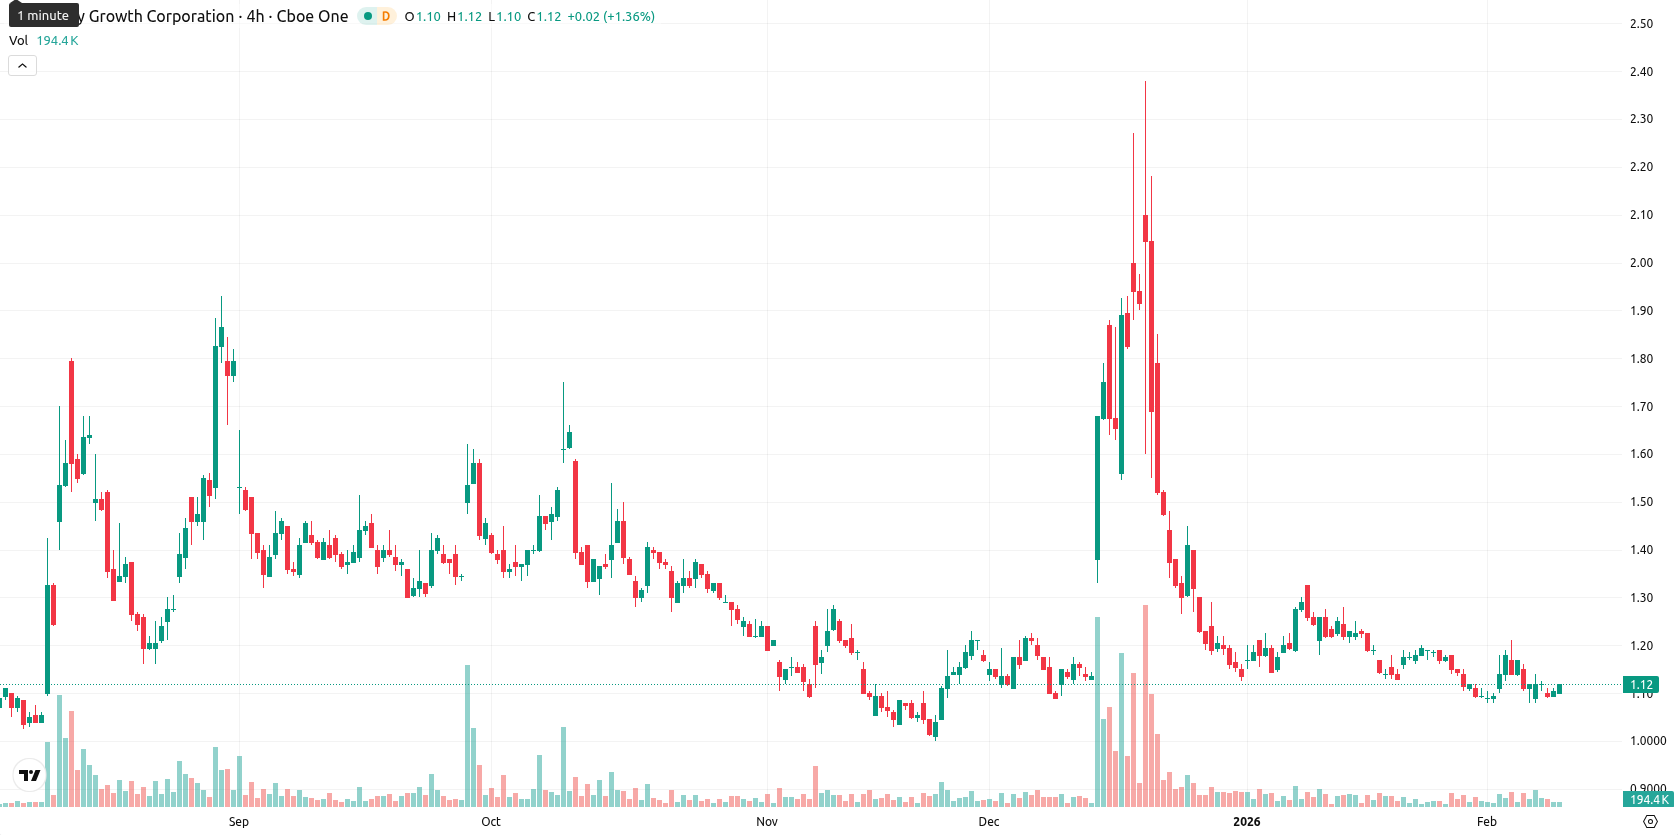
Canopy Growth Corporation (CGC) is trading at $1.13, up $0.04 or 3.67% on the day. The price remains below the MA-20 ($1.16), MA-50 ($1.24), and MA-200 ($1.31), indicating continued downward pressure relative to key short-, medium-, and long-term moving averages.
Highlights
- Canopy Growth trades at $1.13, below its MA-20 ($1.16), MA-50 ($1.24), and MA-200 ($1.31), confirming persistent downward pressure across all timeframes.
- Bearish momentum dominates—MACD and ADX are weak, RSI is depressed at 41.60, and CCI is oversold at -111.02, with sellers leading at the daily level.
- For the coming week, trading is expected between $1.09 and $1.15; a break below $1.09 targets $1.06, while resistance sits at $1.21 (Ichimoku Kijun).
Oversold readings deepen as negative momentum persists below resistance
Momentum signals remain bearish, with the daily MACD and ADX both indicating weak, negative momentum and the ADX confirming a lack of strong trend. Oscillators are under pressure: the RSI is subdued at 41.60, the Stochastic RSI is neutral at 30.22, and the CCI is oversold at -111.02, while Bull/Bear Power shows sellers continuing to dominate on the daily chart. The nearest resistance is the Ichimoku Kijun level at $1.21, with immediate support in the MA-5 range. The Awesome Oscillator is neutral and offers no clear directional signal, while prices are near the upper end of today's range despite overall bearish momentum and oversold readings.
Bearish bias dominates as tight trading range limits upside
For the coming week, the expected trading band is $1.09 to $1.15, reflecting typical volatility relative to current levels. The probability of further upside is low — below 20% — suggesting downside moves are more likely. The base scenario is consolidation within this range, with stronger bearish momentum possible if the price breaks below $1.09 (downside scenario), and any bullish reversal would require a break above $1.21 to target the MA-50 at $1.24 (upside scenario).
Previously it was reported that Canopy Growth Corporation is trading below its major moving averages, underscoring persistent bearish momentum across short, medium, and long-term timeframes, while momentum indicators such as MACD and ADX reflect weak and indecisive trend strength. Despite a brief intraday price recovery and oversold readings on daily oscillators, the stock continues to face significant technical resistance, signaling limited near-term upside potential.


Latest Canopy Growth News


-
 Afghanistan
-
 Albania
-
 Algeria
-
 Angola
-
 Argentina
-
 Armenia
-
 Australia
-
 Austria
-
 Azerbaijan
-
 Bahamas
-
 Bahrain
-
 Bangladesh
-
 Belarus
-
 Belgium
-
 Bolivia
-
 Botswana
-
 Brazil
-
 Brunei
-
 Bulgaria
-
 Cambodia
-
 Cameroon
-
 Canada
-
 Chile
Chile
-
 China
China
-
 Colombia
-
 Congo
Congo
-
 Costa Rica
-
 Cote d'Ivoire
-
 Croatia
-
 Cuba
Cuba
-
 Cyprus
-
 Czechia
-
 DR Congo
-
 Denmark
-
 Dominican Republic
-
 Ecuador
-
 Egypt
Egypt
-
 El Salvador
-
 Estonia
-
 Eswatini
-
 Ethiopia
-
 Finland
-
 France
-
 Georgia
-
 Germany
-
 Ghana
Ghana
-
 Greece
-
 Haiti
Haiti
-
 Hong Kong
-
 Hungary
-
 India
India
-
 Indonesia
-
 Iran, Islamic republic
-
 Iraq
Iraq
-
 Ireland
-
 Israel
-
 Italy
Italy
-
 Jamaica
-
 Japan
Japan
-
 Jordan
-
 Kazakhstan
-
 Kenya
Kenya
-
 Korea
Korea
-
 Kuwait
-
 Kyrgyzstan
-
 Laos
Laos
-
 Latvia
-
 Lebanon
-
 Lesotho
-
 Libya
Libya
-
 Lithuania
-
 Luxembourg
-
 Madagascar
-
 Malaysia
-
 Malta
Malta
-
 Mauritius
-
 Mexico
-
 Moldova
-
 Mongolia
-
 Montenegro
-
 Morocco
-
 Mozambique
-
 Myanmar
-
 Namibia
-
 Nepal
Nepal
-
 Netherlands
-
 New Zealand
-
 Nigeria
-
 North Macedonia
-
 Norway
-
 Oman
Oman
-
 Pakistan
-
 Palestine
-
 Panama
-
 Papua New Guinea
-
 Paraguay
-
 Peru
Peru
-
 Philippines
-
 Poland
-
 Portugal
-
 Puerto Rico
-
 Qatar
Qatar
-
 Reunion
-
 Romania
-
 Rwanda
-
 Saudi Arabia
-
 Serbia
-
 Singapore
-
 Slovakia
-
 Slovenia
-
 Somalia
-
 South Africa
-
 Spain
Spain
-
 Sri Lanka
-
 Sweden
-
 Switzerland
-
 Syria
Syria
-
 Taiwan
-
 Tajikistan
-
 Tanzania
-
 Thailand
-
 Trinidad and Tobago
-
 Tunisia
-
 Turkey
-
 UAE
UAE
-
 Uganda
-
 Ukraine
-
 United Kingdom
-
United States
-
 Uruguay
-
 Uzbekistan
-
 Venezuela
-
 Vietnam
-
 Yemen
Yemen
-
 Zambia
-
 Zimbabwe
- Forex
- Crypto
