
Microsoft gains 2.90% while remaining under bearish momentum, rangebound between $400 and $425 – weekly report

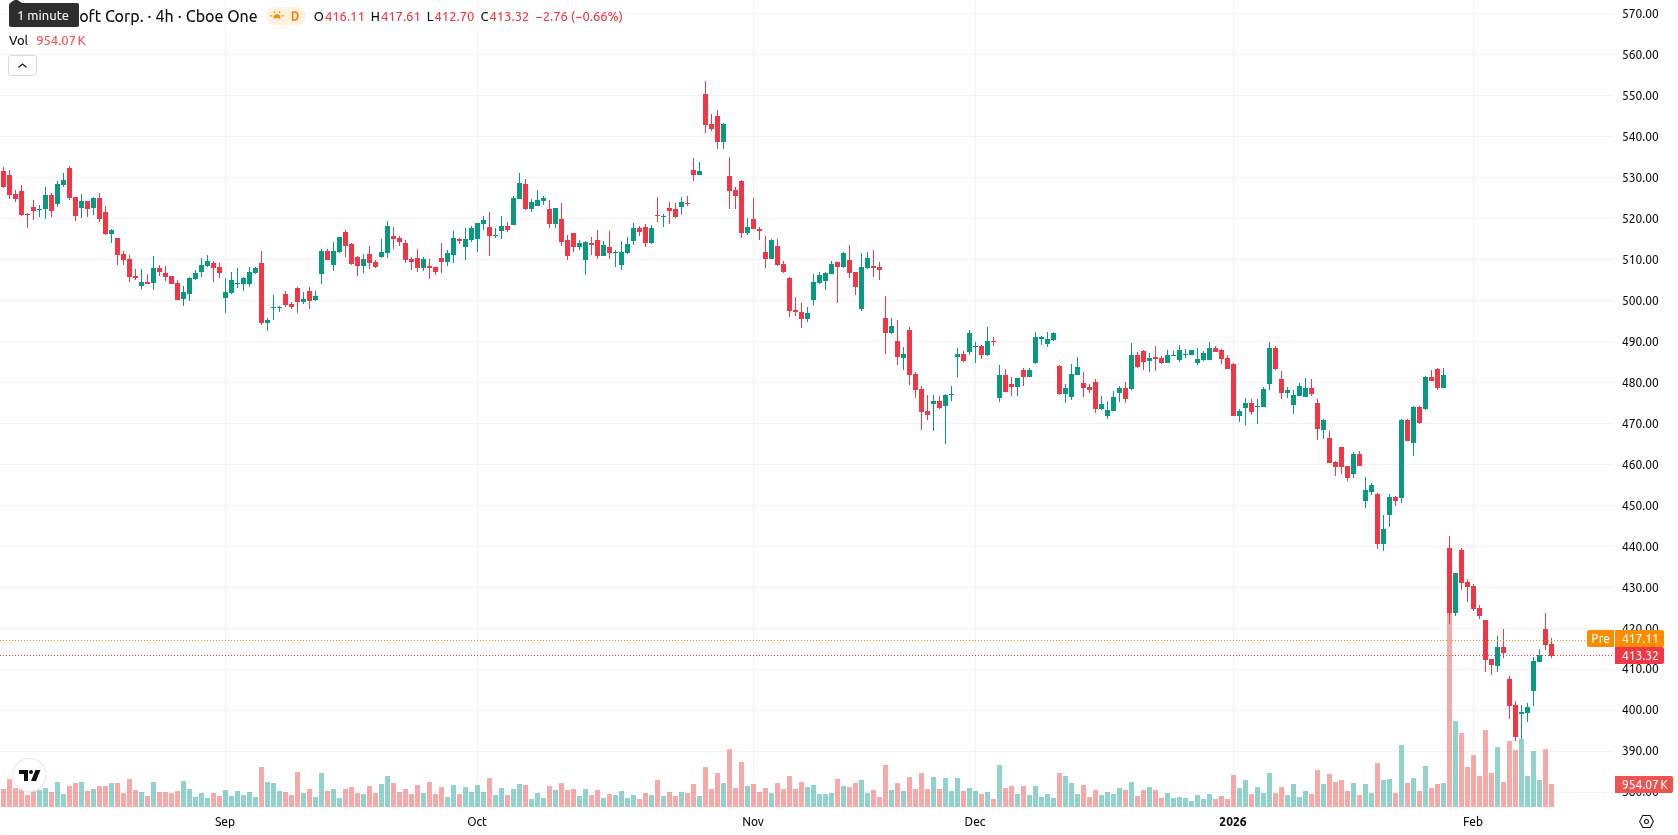
Microsoft Corporation (MSFT) ended the week at $413.34, slipping 0.06% over the past seven days. The stock remains under bearish pressure on the weekly (W1) timeframe, trading below the MA-20 ($441.49), MA-50 ($466.16), and MA-200 ($487.22) moving averages, and approaching the lower boundary of recent weekly ranges.
Highlights
- Microsoft trades at $413.34, below the MA-20 ($441.49), MA-50 ($466.16), and MA-200 ($487.22), signaling broad bearish pressure across all timeframes.
- Momentum indicators (MACD, ADX) confirm ongoing bearish strength, while RSI at 36 and Bull/Bear Power in oversold territory suggest sellers dominate but no reversal is evident.
- Short-term trading range is expected between $400.00 support and $425.00 resistance, with an over 80% probability of further declines in the next five sessions.
Upbeat earnings and AI investment shape sentiment despite capital outlay
Microsoft reported strong Q2 fiscal 2026 results with revenue of $81.3 billion, up 17% year over year, and non-GAAP EPS of $4.14. The company also announced a new partnership with Capgemini to expand its Sovereign Cloud services aimed at government and regulated sectors. Elevated capital expenditures of $37.5 billion were disclosed, mainly to support AI infrastructure initiatives.
Downward momentum sustained as MSFT approaches oversold on weekly signals
On the weekly chart, MSFT remains below major moving averages (MA-20, MA-50, MA-200), underlining persistent downward momentum. Key resistance sits near the Ichimoku Kijun at $441.01, while support is established at $400, with upside capped by $425. The RSI (W1) is near 36, signaling that the stock is approaching oversold territory, but other weekly indicators do not yet show a sign of reversal. No golden or death cross has developed, and momentum readings confirm seller dominance.
Sideways-to-lower bias seen next week with $400 at risk of breakdown
For the next five to seven trading days, Microsoft is expected to trade within a $400.00 – $425.00 range, with a strong probability (over 80%) of sideways to lower movement. The base scenario anticipates consolidation between $400 support and $425 resistance. A breakout above the Ichimoku Kijun at $441 would suggest a short-term bullish reversal, while a sustained move below $400 may accelerate the downtrend.
Last time, analysts noted that Microsoft is exhibiting persistent bearish momentum, with the stock trading well below major moving averages and key technical indicators such as MACD ADX and RSI pointing to continued weakness. Immediate support lies near $412, resistance is set around $441, and the probability of a near-term rebound remains low given sustained oversold conditions and prevailing downside risk.


Latest Microsoft News


-
 Afghanistan
-
 Albania
-
 Algeria
-
 Angola
-
 Argentina
-
 Armenia
-
 Australia
-
 Austria
-
 Azerbaijan
-
 Bahamas
-
 Bahrain
-
 Bangladesh
-
 Belarus
-
 Belgium
-
 Bolivia
-
 Botswana
-
 Brazil
-
 Brunei
-
 Bulgaria
-
 Cambodia
-
 Cameroon
-
 Canada
-
 Chile
Chile
-
 China
China
-
 Colombia
-
 Congo
Congo
-
 Costa Rica
-
 Cote d'Ivoire
-
 Croatia
-
 Cuba
Cuba
-
 Cyprus
-
 Czechia
-
 DR Congo
-
 Denmark
-
 Dominican Republic
-
 Ecuador
-
 Egypt
Egypt
-
 El Salvador
-
 Estonia
-
 Eswatini
-
 Ethiopia
-
 Finland
-
 France
-
 Georgia
-
 Germany
-
 Ghana
Ghana
-
 Greece
-
 Haiti
Haiti
-
 Hong Kong
-
 Hungary
-
 India
India
-
 Indonesia
-
 Iran, Islamic republic
-
 Iraq
Iraq
-
 Ireland
-
 Israel
-
 Italy
Italy
-
 Jamaica
-
 Japan
Japan
-
 Jordan
-
 Kazakhstan
-
 Kenya
Kenya
-
 Korea
Korea
-
 Kuwait
-
 Kyrgyzstan
-
 Laos
Laos
-
 Latvia
-
 Lebanon
-
 Lesotho
-
 Libya
Libya
-
 Lithuania
-
 Luxembourg
-
 Madagascar
-
 Malaysia
-
 Malta
Malta
-
 Mauritius
-
 Mexico
-
 Moldova
-
 Mongolia
-
 Montenegro
-
 Morocco
-
 Mozambique
-
 Myanmar
-
 Namibia
-
 Nepal
Nepal
-
 Netherlands
-
 New Zealand
-
 Nigeria
-
 North Macedonia
-
 Norway
-
 Oman
Oman
-
 Pakistan
-
 Palestine
-
 Panama
-
 Papua New Guinea
-
 Paraguay
-
 Peru
Peru
-
 Philippines
-
 Poland
-
 Portugal
-
 Puerto Rico
-
 Qatar
Qatar
-
 Reunion
-
 Romania
-
 Rwanda
-
 Saudi Arabia
-
 Serbia
-
 Singapore
-
 Slovakia
-
 Slovenia
-
 Somalia
-
 South Africa
-
 Spain
Spain
-
 Sri Lanka
-
 Sweden
-
 Switzerland
-
 Syria
Syria
-
 Taiwan
-
 Tajikistan
-
 Tanzania
-
 Thailand
-
 Trinidad and Tobago
-
 Tunisia
-
 Turkey
-
 UAE
UAE
-
 Uganda
-
 Ukraine
-
 United Kingdom
-
United States
-
 Uruguay
-
 Uzbekistan
-
 Venezuela
-
 Vietnam
-
 Yemen
Yemen
-
 Zambia
-
 Zimbabwe
- Forex
- Crypto
