
Adobe stock: Bearish indicators and lack of support drive fresh decline

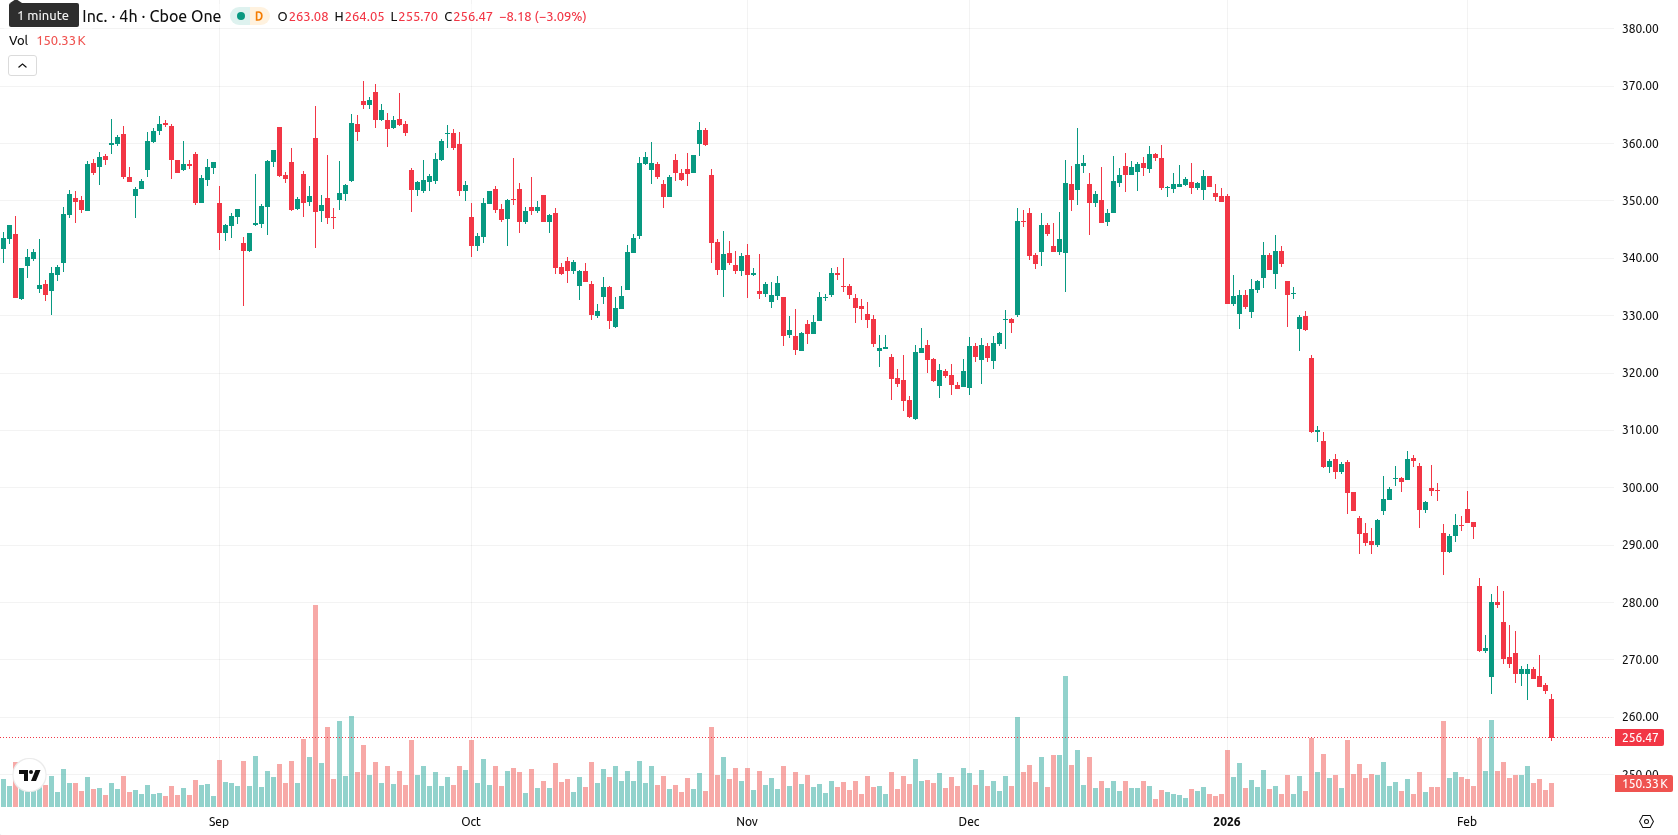
Adobe Inc. (ADBE) is trading at $256.09 after a 3.25% daily decline, having opened at $263.10 and currently sitting near today's low. The price remains significantly below key moving averages — MA-20 ($290.06), MA-50 ($321.59), and MA-200 ($353.61) — highlighting seller dominance across all timeframes.
Highlights
- Adobe reported operating cash flow exceeding $10 billion for fiscal 2025, driven by a 35% increase in monthly active users from AI-powered feature adoption like Firefly.
- The company is intensifying efforts to monetize its 70 million+ free user base, amid shifting institutional investor stakes and mixed option market sentiment.
- ADBE trades at $256.09, far below key moving averages, with strong bearish momentum and a likely trading range of $245.00–$265.00 for the coming week.
Cash flow strength and user growth fuel mixed investor action
Adobe recently reported operating cash flow exceeding $10 billion for fiscal 2025, supported by a 35% increase in monthly active users attributed to widespread adoption of its AI-powered features, notably Firefly. The company continues to focus on monetizing its large free user base, now over 70 million, amid ongoing market attention to its transition efforts. Regulatory filings also reveal changes in institutional holdings, with investors like ING Groep NV increasing their stakes, while others have trimmed positions, and recent option market data reflects mixed sentiment.
Persistent bearish momentum amid oversold signals and weak support
Technically, ADBE faces resistance from the Ichimoku Kijun at $303.45 and lacks strong support levels above the current price. Bearish momentum is confirmed by MACD and ADX, while oversold readings from RSI (25.43), Stochastic RSI (15.75), and CCI (–136.97) indicate sellers have maintained control. Bull/Bear Power (–11.43) remains in deeply negative territory, reinforcing intraday bearishness. The session's high volatility and the absence of a reversal signal further support the prevailing downward pressure.
Further downside likely as volatility dominates near key levels
Looking ahead, the anticipated short-term price range for ADBE is $245.00 – $265.00, reflecting typical volatility bands near current levels. There is a very high probability — over 80% — of further price declines, while a rebound appears unlikely. Sideways trading could develop if buyers and sellers reach a weak balance. A move above $265.00 toward $270.00 – $275.00 would be required to challenge the bearish setup, while a break below $245.00 could accelerate losses given a lack of nearby technical support.
Previously it was reported that Adobe Inc. remains below all key moving averages, with persistent bearish momentum underscored by negative MACD, ADX, and oscillator signals, despite intraday oversold conditions highlighted by low RSI and CCI readings. The stock faces resistance near $313.88 and support in the lower $270s, with a sideways trading range expected as negative technical signals offset short-term recovery attempts.


Latest Adobe News


-
 Afghanistan
-
 Albania
-
 Algeria
-
 Angola
-
 Argentina
-
 Armenia
-
 Australia
-
 Austria
-
 Azerbaijan
-
 Bahamas
-
 Bahrain
-
 Bangladesh
-
 Belarus
-
 Belgium
-
 Bolivia
-
 Botswana
-
 Brazil
-
 Brunei
-
 Bulgaria
-
 Cambodia
-
 Cameroon
-
 Canada
-
 Chile
Chile
-
 China
China
-
 Colombia
-
 Congo
Congo
-
 Costa Rica
-
 Cote d'Ivoire
-
 Croatia
-
 Cuba
Cuba
-
 Cyprus
-
 Czechia
-
 DR Congo
-
 Denmark
-
 Dominican Republic
-
 Ecuador
-
 Egypt
Egypt
-
 El Salvador
-
 Estonia
-
 Eswatini
-
 Ethiopia
-
 Finland
-
 France
-
 Georgia
-
 Germany
-
 Ghana
Ghana
-
 Greece
-
 Haiti
Haiti
-
 Hong Kong
-
 Hungary
-
 India
India
-
 Indonesia
-
 Iran, Islamic republic
-
 Iraq
Iraq
-
 Ireland
-
 Israel
-
 Italy
Italy
-
 Jamaica
-
 Japan
Japan
-
 Jordan
-
 Kazakhstan
-
 Kenya
Kenya
-
 Korea
Korea
-
 Kuwait
-
 Kyrgyzstan
-
 Laos
Laos
-
 Latvia
-
 Lebanon
-
 Lesotho
-
 Libya
Libya
-
 Lithuania
-
 Luxembourg
-
 Madagascar
-
 Malaysia
-
 Malta
Malta
-
 Mauritius
-
 Mexico
-
 Moldova
-
 Mongolia
-
 Montenegro
-
 Morocco
-
 Mozambique
-
 Myanmar
-
 Namibia
-
 Nepal
Nepal
-
 Netherlands
-
 New Zealand
-
 Nigeria
-
 North Macedonia
-
 Norway
-
 Oman
Oman
-
 Pakistan
-
 Palestine
-
 Panama
-
 Papua New Guinea
-
 Paraguay
-
 Peru
Peru
-
 Philippines
-
 Poland
-
 Portugal
-
 Puerto Rico
-
 Qatar
Qatar
-
 Reunion
-
 Romania
-
 Rwanda
-
 Saudi Arabia
-
 Serbia
-
 Singapore
-
 Slovakia
-
 Slovenia
-
 Somalia
-
 South Africa
-
 Spain
Spain
-
 Sri Lanka
-
 Sweden
-
 Switzerland
-
 Syria
Syria
-
 Taiwan
-
 Tajikistan
-
 Tanzania
-
 Thailand
-
 Trinidad and Tobago
-
 Tunisia
-
 Turkey
-
 UAE
UAE
-
 Uganda
-
 Ukraine
-
 United Kingdom
-
United States
-
 Uruguay
-
 Uzbekistan
-
 Venezuela
-
 Vietnam
-
 Yemen
Yemen
-
 Zambia
-
 Zimbabwe
- Forex
- Crypto
