
Palantir stock price forecast: Downtrend persists as PLTR fails to reclaim key resistance

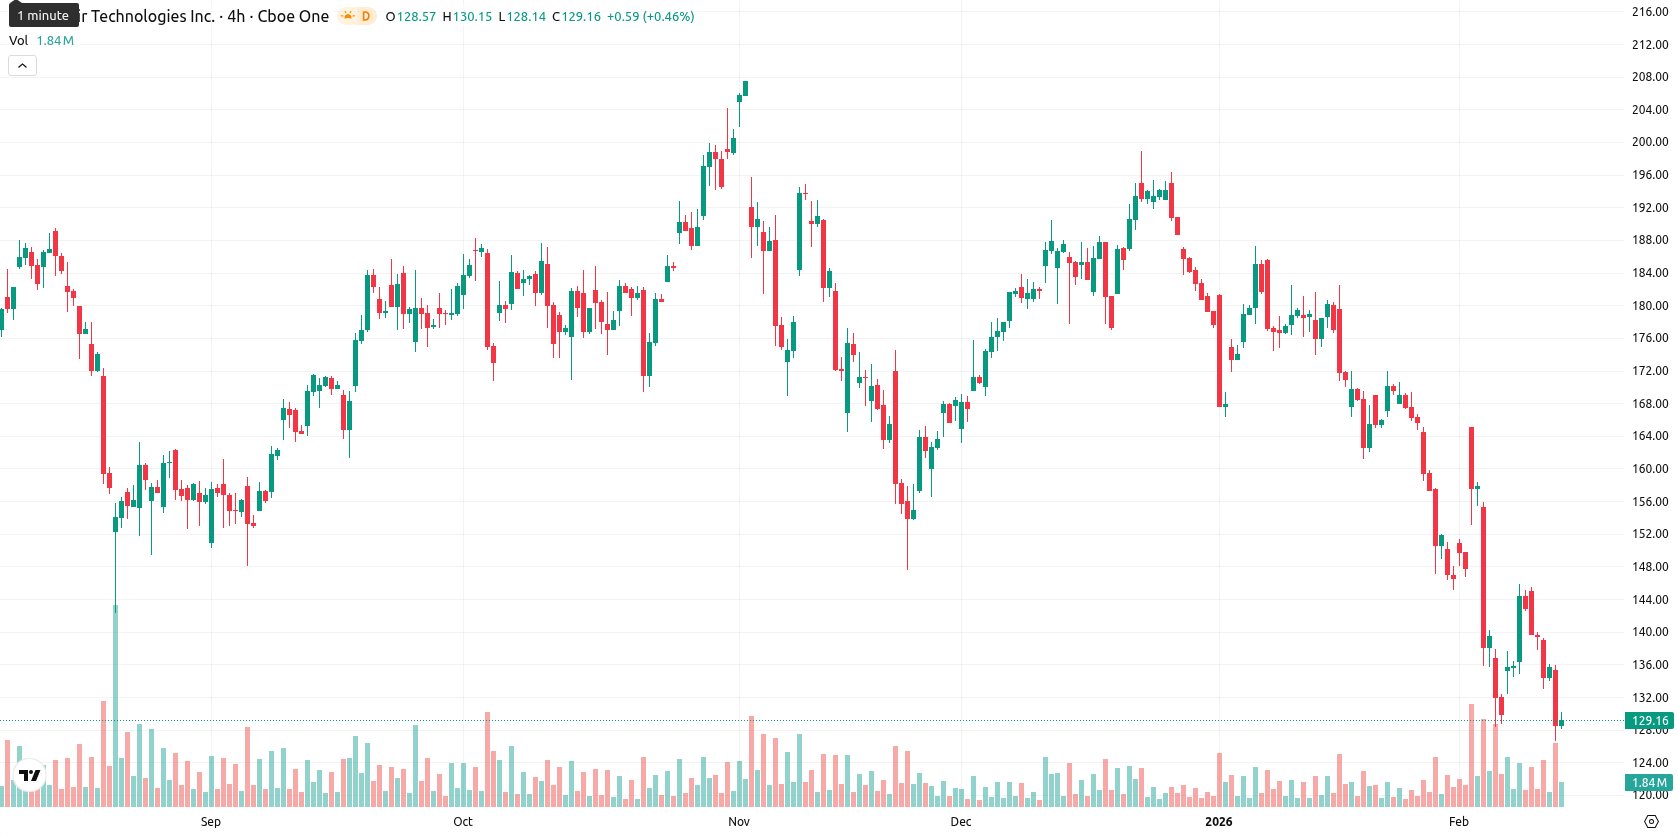
Palantir Technologies Inc (PLTR) is trading at $129.38, positioning well below the MA-20 ($153.25), MA-50 ($170.59), and MA-200 ($160.68), which points to persistent pressure from sellers across short-, medium-, and long-term trends. The modest daily increase of 0.18% does not correspond with the bearish momentum, signaling a divergence between price action and indicator signals as the asset remains under its key moving averages.
Highlights
- Palantir's Q4 revenue surged 70% year-over-year to $1.4 billion, driven by a 137% increase in U.S. commercial revenue and strong AI platform uptake.
- The company renewed its multi-year Skywise contract with Airbus and received DISA cloud authorization for edge and on-premises deployments, signaling operational momentum amid concerns over spending and stock-based compensation.
- PLTR trades at $129.38, well below MA-20, MA-50, and MA-200, with technical indicators signaling persistent bearish momentum and a likely trading range of $124.50 to $135.50 in the coming week.
Operational victories offset by investor caution on expenses
Palantir reported a strong fourth quarter with revenue rising 70% year-over-year to $1.4 billion, supported by a 137% jump in U.S. commercial revenue and robust AI platform adoption. The company renewed its multi-year contract with Airbus for the Skywise data platform and received key DISA cloud authorization for edge and on-premises deployments. Despite the earnings beat and operational wins, concerns about past spending and stock-based compensation were raised by market participants.
Downside risk builds as sellers dominate near resistance
The nearest dynamic resistance is at the Ichimoku Kijun level of $156.95, and no golden or death cross is currently signaled between the MA-50 and MA-200. Momentum indicators reinforce the bearish tone: both MACD and ADX indicate selling pressure, with MACD showing further deterioration and ADX at moderate trend strength. RSI and CCI highlight PLTR as nearly oversold, while Stochastic RSI is neutral; Bull/Bear Power is strongly negative, signaling firm seller dominance within the session. The Awesome Oscillator remains neutral and does not reinforce the current downtrend.
Sideways outlook established amid weak bullish probability
For the upcoming week, PLTR is likely to move within a $124.50 to $135.50 volatility band relative to current levels. There is less than a 20% probability of a price increase, with a sideways movement in this corridor being the baseline scenario. A bullish move would require a breakout above $135.50 and a sustained close above the Ichimoku Kijun. In a bearish scenario, a drop below $124.50 could lead to further weakness as multi-timeframe momentum favors the downside.
Previously it was reported that Palantir Technologies Inc. continues to face sustained downside pressure, trading well below its key moving averages across all timeframes, with technical indicators such as MACD, ADX, RSI, and CCI signaling ongoing negative momentum and oversold conditions. The lack of meaningful support below current levels and resistance capped near $157.80 suggest limited upside potential in the near term despite elevated volatility and positive business developments.


-
 Afghanistan
-
 Albania
-
 Algeria
-
 Angola
-
 Argentina
-
 Armenia
-
 Australia
-
 Austria
-
 Azerbaijan
-
 Bahamas
-
 Bahrain
-
 Bangladesh
-
 Belarus
-
 Belgium
-
 Bolivia
-
 Botswana
-
 Brazil
-
 Brunei
-
 Bulgaria
-
 Cambodia
-
 Cameroon
-
 Canada
-
 Chile
Chile
-
 China
China
-
 Colombia
-
 Congo
Congo
-
 Costa Rica
-
 Cote d'Ivoire
-
 Croatia
-
 Cuba
Cuba
-
 Cyprus
-
 Czechia
-
 DR Congo
-
 Denmark
-
 Dominican Republic
-
 Ecuador
-
 Egypt
Egypt
-
 El Salvador
-
 Estonia
-
 Eswatini
-
 Ethiopia
-
 Finland
-
 France
-
 Georgia
-
 Germany
-
 Ghana
Ghana
-
 Greece
-
 Haiti
Haiti
-
 Hong Kong
-
 Hungary
-
 India
India
-
 Indonesia
-
 Iran, Islamic republic
-
 Iraq
Iraq
-
 Ireland
-
 Israel
-
 Italy
Italy
-
 Jamaica
-
 Japan
Japan
-
 Jordan
-
 Kazakhstan
-
 Kenya
Kenya
-
 Korea
Korea
-
 Kuwait
-
 Kyrgyzstan
-
 Laos
Laos
-
 Latvia
-
 Lebanon
-
 Lesotho
-
 Libya
Libya
-
 Lithuania
-
 Luxembourg
-
 Madagascar
-
 Malaysia
-
 Malta
Malta
-
 Mauritius
-
 Mexico
-
 Moldova
-
 Mongolia
-
 Montenegro
-
 Morocco
-
 Mozambique
-
 Myanmar
-
 Namibia
-
 Nepal
Nepal
-
 Netherlands
-
 New Zealand
-
 Nigeria
-
 North Macedonia
-
 Norway
-
 Oman
Oman
-
 Pakistan
-
 Palestine
-
 Panama
-
 Papua New Guinea
-
 Paraguay
-
 Peru
Peru
-
 Philippines
-
 Poland
-
 Portugal
-
 Puerto Rico
-
 Qatar
Qatar
-
 Reunion
-
 Romania
-
 Rwanda
-
 Saudi Arabia
-
 Serbia
-
 Singapore
-
 Slovakia
-
 Slovenia
-
 Somalia
-
 South Africa
-
 Spain
Spain
-
 Sri Lanka
-
 Sweden
-
 Switzerland
-
 Syria
Syria
-
 Taiwan
-
 Tajikistan
-
 Tanzania
-
 Thailand
-
 Trinidad and Tobago
-
 Tunisia
-
 Turkey
-
 UAE
UAE
-
 Uganda
-
 Ukraine
-
 United Kingdom
-
United States
-
 Uruguay
-
 Uzbekistan
-
 Venezuela
-
 Vietnam
-
 Yemen
Yemen
-
 Zambia
-
 Zimbabwe
- Forex
- Crypto
