
Palantir stock price forecast: Bearish technicals persist as PLTR gains 3.56% after Denver protests

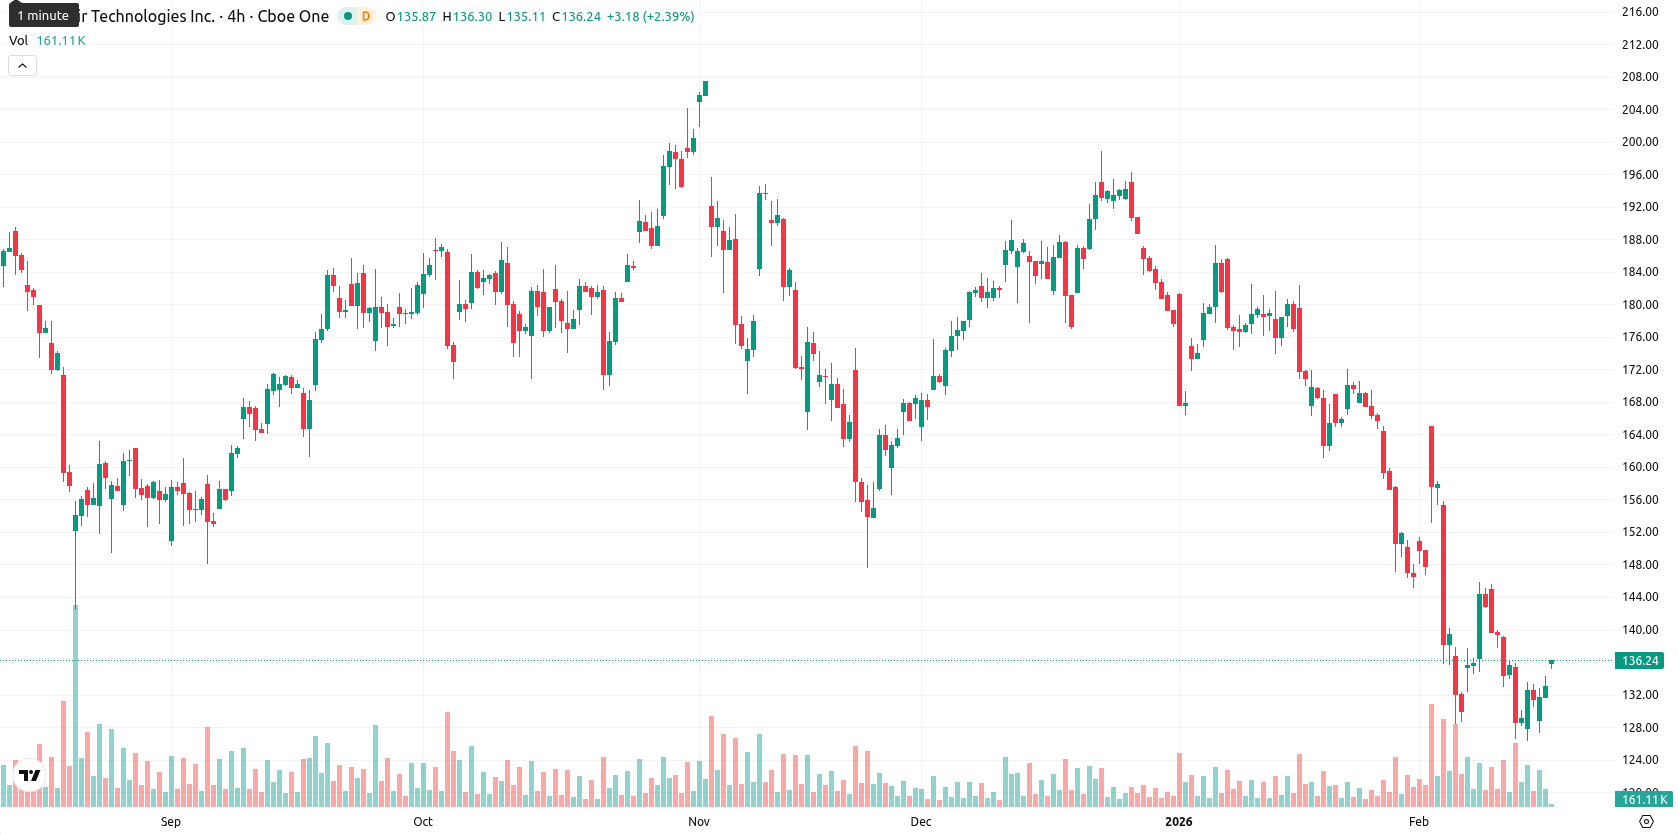
Palantir Technologies Inc (PLTR) is trading at $137.76, sitting below the MA-20 ($149.06), MA-50 ($168.94), and MA-200 ($160.83), which signals ongoing short-, medium-, and long-term selling pressure. The asset remains firmly under its longer-term moving averages, suggesting sellers are still in control.
Highlights
- Palantir has moved its global headquarters from Denver to Miami, citing Colorado's 2024 AI regulatory bill and compliance cost concerns.
- Despite ongoing protests in Denver regarding government contracts, Palantir reported strong year-over-year revenue growth in both government and US commercial segments, with positive fiscal 2026 guidance.
- PLTR trades at $137.76, below key moving averages (MA-20: $149.06, MA-50: $168.94), with sellers maintaining control and a likely range of $132.00–$143.00 over the next five days.
Headquarters move and regulatory concerns amid robust revenue growth
Palantir has relocated its global headquarters from Denver, Colorado to Miami, Florida, citing concerns about compliance costs from Colorado's 2024 AI regulatory bill. The move was announced on social media and in its annual filing, and came amid protests in Denver related to Palantir's US government contracts. Despite the controversy, Palantir delivered strong year-over-year revenue growth in both its government and US commercial segments and issued positive guidance for fiscal 2026.
Bearish momentum persists as indicators fail to show oversold conditions
Technically, PLTR faces dynamic resistance at the Ichimoku Kijun level of $154.43, with all significant moving averages above the current price. Momentum indicators such as the MACD and ADX signal a bearish setup, while most oscillators (RSI at 35.12, CCI at -93.34) show the stock is not yet oversold, though Bull/Bear Power indicates sellers are dominant. The session opened with a gap up near the top of today's tight $135.23 to $136.25 range, demonstrating low volatility and post-open strength. Some oscillators show early signs of stabilization, but overall momentum indicators remain negative, with the Awesome Oscillator neutral.
Limited upside potential as weekly trend signals favor further weakness
In the next five days, PLTR is expected to trade within a typical volatility band between $132.00 and $143.00, as weekly momentum and trend indicators do not suggest a bullish reversal. The likelihood of a price increase is low (below 20%), favoring further downside or sideways movement. If the price breaks above $143.00, the next resistance is near $149.00, while a drop below $132.00 could lead to additional selling pressure and lower supports.
Previously it was reported that Palantir Technologies Inc. remains under broad bearish pressure, with its price trading well below key moving averages and technical indicators such as the MACD and ADX signaling persistent downside momentum. Despite recent oversold readings from RSI, CCI, and BBP, and an intraday rebound toward session highs, the stock faces strong resistance near $156 and shows mixed short-term oscillator signals, suggesting continued seller dominance across major time frames.


-
 Afghanistan
-
 Albania
-
 Algeria
-
 Angola
-
 Argentina
-
 Armenia
-
 Australia
-
 Austria
-
 Azerbaijan
-
 Bahamas
-
 Bahrain
-
 Bangladesh
-
 Belarus
-
 Belgium
-
 Bolivia
-
 Botswana
-
 Brazil
-
 Brunei
-
 Bulgaria
-
 Cambodia
-
 Cameroon
-
 Canada
-
 Chile
Chile
-
 China
China
-
 Colombia
-
 Congo
Congo
-
 Costa Rica
-
 Cote d'Ivoire
-
 Croatia
-
 Cuba
Cuba
-
 Cyprus
-
 Czechia
-
 DR Congo
-
 Denmark
-
 Dominican Republic
-
 Ecuador
-
 Egypt
Egypt
-
 El Salvador
-
 Estonia
-
 Eswatini
-
 Ethiopia
-
 Finland
-
 France
-
 Georgia
-
 Germany
-
 Ghana
Ghana
-
 Greece
-
 Haiti
Haiti
-
 Hong Kong
-
 Hungary
-
 India
India
-
 Indonesia
-
 Iran, Islamic republic
-
 Iraq
Iraq
-
 Ireland
-
 Israel
-
 Italy
Italy
-
 Jamaica
-
 Japan
Japan
-
 Jordan
-
 Kazakhstan
-
 Kenya
Kenya
-
 Korea
Korea
-
 Kuwait
-
 Kyrgyzstan
-
 Laos
Laos
-
 Latvia
-
 Lebanon
-
 Lesotho
-
 Libya
Libya
-
 Lithuania
-
 Luxembourg
-
 Madagascar
-
 Malaysia
-
 Malta
Malta
-
 Mauritius
-
 Mexico
-
 Moldova
-
 Mongolia
-
 Montenegro
-
 Morocco
-
 Mozambique
-
 Myanmar
-
 Namibia
-
 Nepal
Nepal
-
 Netherlands
-
 New Zealand
-
 Nigeria
-
 North Macedonia
-
 Norway
-
 Oman
Oman
-
 Pakistan
-
 Palestine
-
 Panama
-
 Papua New Guinea
-
 Paraguay
-
 Peru
Peru
-
 Philippines
-
 Poland
-
 Portugal
-
 Puerto Rico
-
 Qatar
Qatar
-
 Reunion
-
 Romania
-
 Rwanda
-
 Saudi Arabia
-
 Serbia
-
 Singapore
-
 Slovakia
-
 Slovenia
-
 Somalia
-
 South Africa
-
 Spain
Spain
-
 Sri Lanka
-
 Sweden
-
 Switzerland
-
 Syria
Syria
-
 Taiwan
-
 Tajikistan
-
 Tanzania
-
 Thailand
-
 Trinidad and Tobago
-
 Tunisia
-
 Turkey
-
 UAE
UAE
-
 Uganda
-
 Ukraine
-
 United Kingdom
-
United States
-
 Uruguay
-
 Uzbekistan
-
 Venezuela
-
 Vietnam
-
 Yemen
Yemen
-
 Zambia
-
 Zimbabwe
- Forex
- Crypto
