
Alphabet steadies above long-term support, faces resistance at $305 amid weakened short-term trend – weekly review

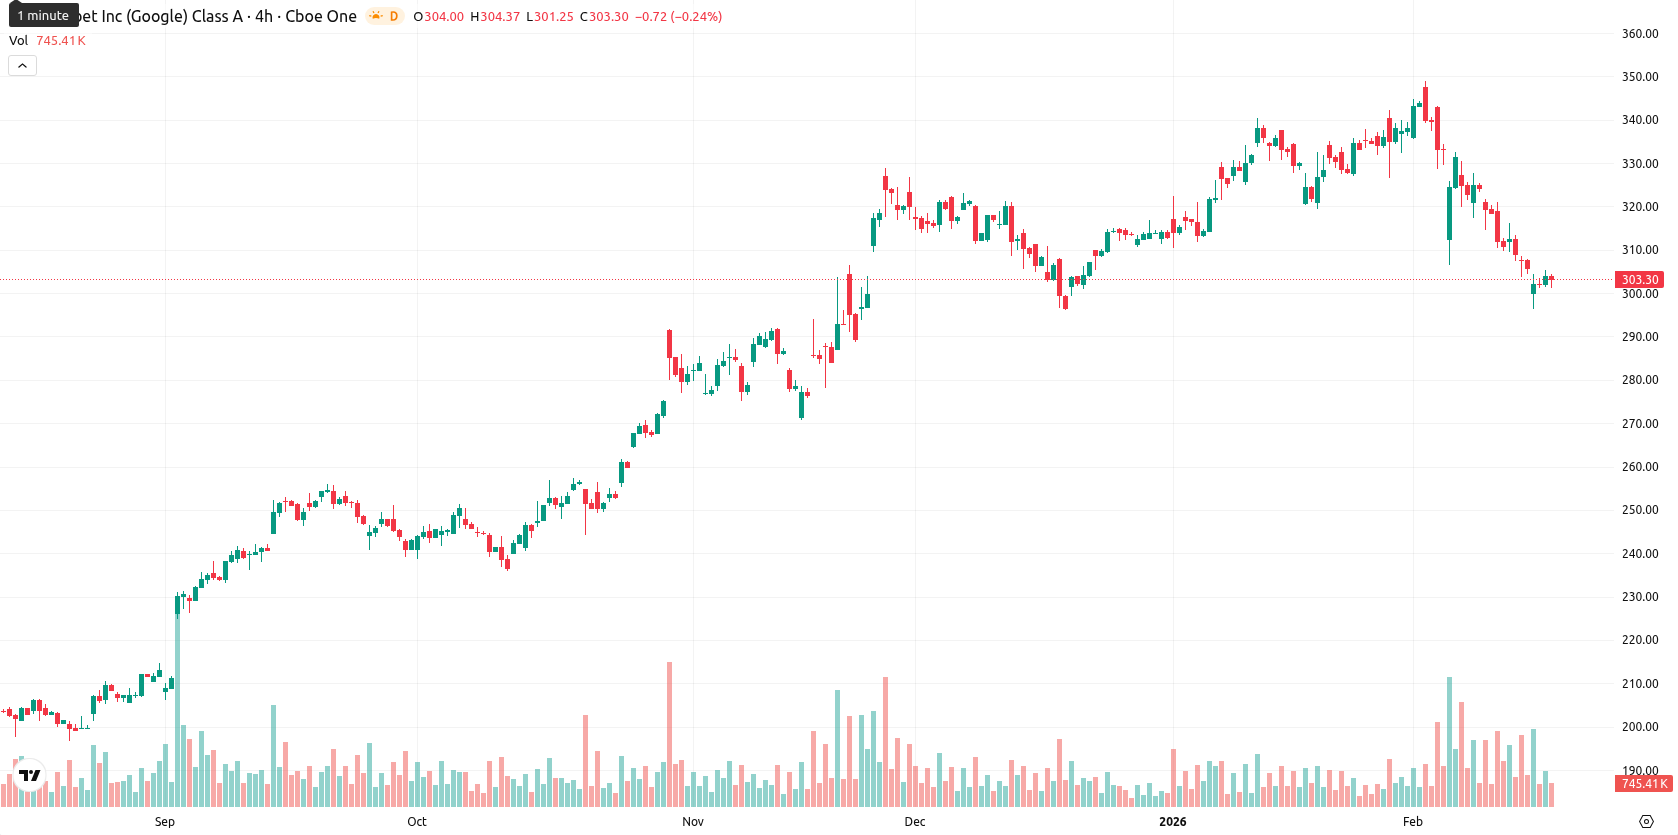
Alphabet Inc. (GOOGL, formerly Google) closed the week at $301.53, posting a modest slide from last Friday to this Friday that translates to a weekly loss of 0.60%. The stock remains decisively below its W1 MA-20 ($325.59) and MA-50 ($320.60), reflecting clear near-term and intermediate-term bearishness, though it is still trading comfortably above the long-term MA-200 ($244.28), which continues to provide key underlying support on a weekly basis.
Highlights
- GOOGL trades at $301.53, below its MA-20 ($325.59) and MA-50 ($320.60), indicating ongoing short- and medium-term bearish momentum.
- Technical momentum is decisively negative with MACD, ADX, and Awesome Oscillator all signaling strong selling, as daily RSI (31.60) and Stochastic RSI (4.62) confirm oversold conditions.
- The immediate resistance zone is $305.00–$306.00, while key support lies near $297.50; price is expected to consolidate within this range over the next five sessions.
Strong earnings and new dividend drive sentiment despite insider sale
Alphabet reported strong recent financial results, with quarterly revenue reaching $113.83 billion and earnings per share of $2.82, surpassing consensus forecasts. The company announced a quarterly dividend payout of $0.21 per share, to be paid on March 16 to shareholders recorded as of March 9, introducing a new capital return event. Institutional investors increased their holdings in the recent quarter, while a director-level share sale and product segment strength, notably driven by AI enhancements, also shaped sentiment.
Bearish momentum persists as oversold signals and key supports emerge
On the W1 timeframe, GOOGL is trading well below both the MA-20 and MA-50, highlighting persistent bearish momentum in the short and medium term, even as it holds above the MA-200, which underscores a resilient long-term structure. Weekly momentum indicators reinforce the downside bias, with negative MACD and a low RSI W1 of 31.60, indicating oversold conditions, while the Stochastic RSI and CCI also point to selling exhaustion. W1 support levels are noted near $297.50, with strong resistance at $305.00 and dynamic resistance around the Ichimoku Kijun at $322.63.
Range-bound trading likely as breakout hurdles and downside risks remain
For the coming week, the price is expected to consolidate within a range of $297.50 to $305.00. W1 technicals imply the probability of a sustained upward move is low, with further downside or range-trading most likely. A bullish breakout would require price action above $305.00 — $306.00, targeting the next resistance. Conversely, if support at $297.50 fails, GOOGL could slide closer to its MA-100, extending the prevailing downtrend.
Previously it was reported that Alphabet Inc. trades below its 20- and 50-day moving averages, reflecting persistent short- to medium-term bearish momentum, while remaining well above the 200-day moving average, which maintains a supportive long-term trend. Technical indicators such as oversold RSI, Stochastic RSI, and CCI suggest a potential for near-term stabilization or a technical bounce, with consolidation likely within a defined volatility range barring a decisive break above resistance or below established support.


-
 Afghanistan
-
 Albania
-
 Algeria
-
 Angola
-
 Argentina
-
 Armenia
-
 Australia
-
 Austria
-
 Azerbaijan
-
 Bahamas
-
 Bahrain
-
 Bangladesh
-
 Belarus
-
 Belgium
-
 Bolivia
-
 Botswana
-
 Brazil
-
 Brunei
-
 Bulgaria
-
 Cambodia
-
 Cameroon
-
 Canada
-
 Chile
Chile
-
 China
China
-
 Colombia
-
 Congo
Congo
-
 Costa Rica
-
 Cote d'Ivoire
-
 Croatia
-
 Cuba
Cuba
-
 Cyprus
-
 Czechia
-
 DR Congo
-
 Denmark
-
 Dominican Republic
-
 Ecuador
-
 Egypt
Egypt
-
 El Salvador
-
 Estonia
-
 Eswatini
-
 Ethiopia
-
 Finland
-
 France
-
 Georgia
-
 Germany
-
 Ghana
Ghana
-
 Greece
-
 Haiti
Haiti
-
 Hong Kong
-
 Hungary
-
 India
India
-
 Indonesia
-
 Iran, Islamic republic
-
 Iraq
Iraq
-
 Ireland
-
 Israel
-
 Italy
Italy
-
 Jamaica
-
 Japan
Japan
-
 Jordan
-
 Kazakhstan
-
 Kenya
Kenya
-
 Korea
Korea
-
 Kuwait
-
 Kyrgyzstan
-
 Laos
Laos
-
 Latvia
-
 Lebanon
-
 Lesotho
-
 Libya
Libya
-
 Lithuania
-
 Luxembourg
-
 Madagascar
-
 Malaysia
-
 Malta
Malta
-
 Mauritius
-
 Mexico
-
 Moldova
-
 Mongolia
-
 Montenegro
-
 Morocco
-
 Mozambique
-
 Myanmar
-
 Namibia
-
 Nepal
Nepal
-
 Netherlands
-
 New Zealand
-
 Nigeria
-
 North Macedonia
-
 Norway
-
 Oman
Oman
-
 Pakistan
-
 Palestine
-
 Panama
-
 Papua New Guinea
-
 Paraguay
-
 Peru
Peru
-
 Philippines
-
 Poland
-
 Portugal
-
 Puerto Rico
-
 Qatar
Qatar
-
 Reunion
-
 Romania
-
 Rwanda
-
 Saudi Arabia
-
 Serbia
-
 Singapore
-
 Slovakia
-
 Slovenia
-
 Somalia
-
 South Africa
-
 Spain
Spain
-
 Sri Lanka
-
 Sweden
-
 Switzerland
-
 Syria
Syria
-
 Taiwan
-
 Tajikistan
-
 Tanzania
-
 Thailand
-
 Trinidad and Tobago
-
 Tunisia
-
 Turkey
-
 UAE
UAE
-
 Uganda
-
 Ukraine
-
 United Kingdom
-
United States
-
 Uruguay
-
 Uzbekistan
-
 Venezuela
-
 Vietnam
-
 Yemen
Yemen
-
 Zambia
-
 Zimbabwe
- Forex
- Crypto
