
Low volatility for Alphabet stock — oversold indicators suggest seller exhaustion near $302

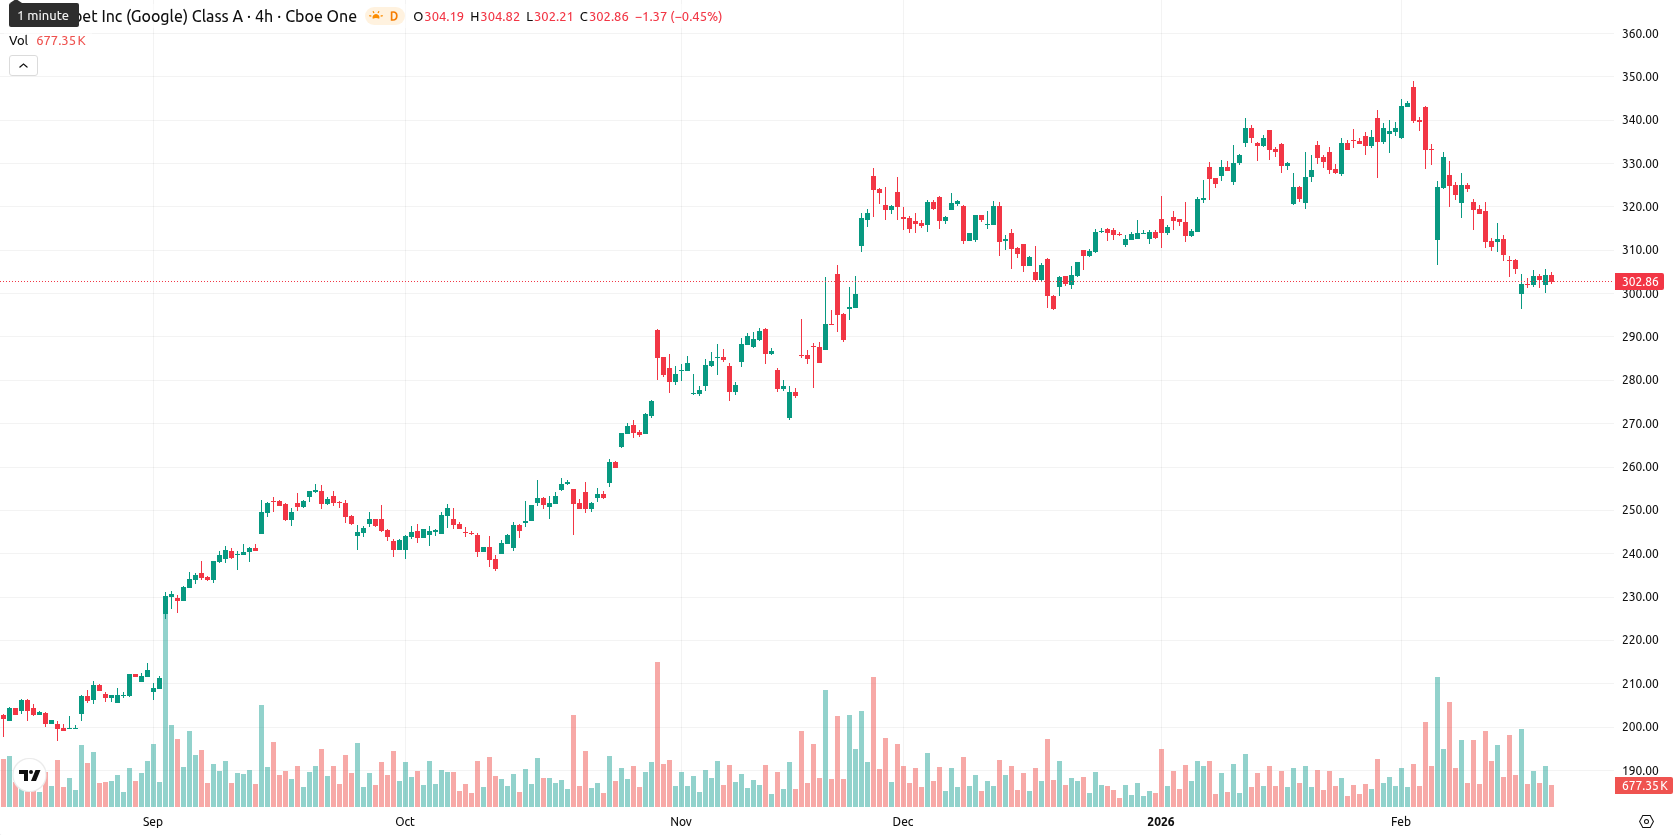
Alphabet Inc. (GOOGL) is trading at $302.78, notably below both its MA-20 ($324.31) and MA-50 ($320.22), which highlights persistent short- and medium-term bearish pressure. However, the stock remains significantly above its MA-200 ($244.97), preserving its long-term bullish structure, while the Ichimoku Kijun at $322.63 presents immediate resistance.
Highlights
- Alphabet reported Q4 2025 EPS of $2.82 and revenue of $113.83 billion, up 18% year-over-year, beating analyst expectations.
- Insider John Kent Walker sold 47,574 shares for $14.3 million, reducing his position by 78%, as Alphabet announced a $0.21 per share dividend.
- GOOGL trades at $302.78, below MA-20 ($324.31) and MA-50 ($320.22), with near-term resistance at $322.63 and expected range of $297.00–$310.00 amid bearish technicals.
Earnings beat and AI gains as insider cuts stake, adjusting institutional flows
Following the release of strong fourth-quarter 2025 results on February 4, Alphabet reported earnings per share of $2.82, exceeding analyst expectations, and an 18% year-over-year rise in revenue to $113.83 billion. The company declared a quarterly dividend of $0.21 per share, with a record date of March 9 and payment on March 16. Additionally, insider John Kent Walker sold 47,574 shares for approximately $14.3 million, reducing his position by 78%, while recent AI developments included Gemini achieving a 77.1% ARC-AGI-2 benchmark score and new partnerships with Sea Ltd and Apple. Institutional activity showed changes in holdings during the third quarter of 2025.
Momentum exhaustion risk as oversold signals appear in active downtrend
Technical indicators confirm a prevailing bearish environment: price is well below both the MA-20 and MA-50, with the Ichimoku Kijun at $322.63 serving as immediate resistance. The daily MACD shows ongoing sell signals, and the ADX confirms an active downtrend. RSI is at 31.20, Stochastic RSI and CCI are all in oversold territory, suggesting potential exhaustion for sellers, yet downside momentum is reinforced by a negative Awesome Oscillator and persistent Bear Power dominance. GOOGL trades near its mid-session range with moderate intraday volatility and continued pressure after the open.
Low rebound odds as sideways trade and bearish extension risks dominate
For the coming week, GOOGL is expected to trade within a $297.00 – $310.00 volatility band relative to current levels. The likelihood of a meaningful rebound remains low, with less than a 20% probability of a sustained upward move based on momentum indicator readings. Sideways movement within this corridor is the base case, while a sustained break above $322.63 would signal a bullish reversal and a confirmed drop below $297.00 would indicate an extension of the bearish trend.
Last time, analysts noted that Alphabet was consolidating near key short-term moving averages after a sharp decline, with price action stabilizing in a range beneath major overhead resistance. Technical indicators showed neutral to slightly weak momentum, with RSI hovering in the low 40s, as the stock oscillated between support at $295 and resistance levels near $315.


-
 Afghanistan
-
 Albania
-
 Algeria
-
 Angola
-
 Argentina
-
 Armenia
-
 Australia
-
 Austria
-
 Azerbaijan
-
 Bahamas
-
 Bahrain
-
 Bangladesh
-
 Belarus
-
 Belgium
-
 Bolivia
-
 Botswana
-
 Brazil
-
 Brunei
-
 Bulgaria
-
 Cambodia
-
 Cameroon
-
 Canada
-
 Chile
Chile
-
 China
China
-
 Colombia
-
 Congo
Congo
-
 Costa Rica
-
 Cote d'Ivoire
-
 Croatia
-
 Cuba
Cuba
-
 Cyprus
-
 Czechia
-
 DR Congo
-
 Denmark
-
 Dominican Republic
-
 Ecuador
-
 Egypt
Egypt
-
 El Salvador
-
 Estonia
-
 Eswatini
-
 Ethiopia
-
 Finland
-
 France
-
 Georgia
-
 Germany
-
 Ghana
Ghana
-
 Greece
-
 Haiti
Haiti
-
 Hong Kong
-
 Hungary
-
 India
India
-
 Indonesia
-
 Iran, Islamic republic
-
 Iraq
Iraq
-
 Ireland
-
 Israel
-
 Italy
Italy
-
 Jamaica
-
 Japan
Japan
-
 Jordan
-
 Kazakhstan
-
 Kenya
Kenya
-
 Korea
Korea
-
 Kuwait
-
 Kyrgyzstan
-
 Laos
Laos
-
 Latvia
-
 Lebanon
-
 Lesotho
-
 Libya
Libya
-
 Lithuania
-
 Luxembourg
-
 Madagascar
-
 Malaysia
-
 Malta
Malta
-
 Mauritius
-
 Mexico
-
 Moldova
-
 Mongolia
-
 Montenegro
-
 Morocco
-
 Mozambique
-
 Myanmar
-
 Namibia
-
 Nepal
Nepal
-
 Netherlands
-
 New Zealand
-
 Nigeria
-
 North Macedonia
-
 Norway
-
 Oman
Oman
-
 Pakistan
-
 Palestine
-
 Panama
-
 Papua New Guinea
-
 Paraguay
-
 Peru
Peru
-
 Philippines
-
 Poland
-
 Portugal
-
 Puerto Rico
-
 Qatar
Qatar
-
 Reunion
-
 Romania
-
 Rwanda
-
 Saudi Arabia
-
 Serbia
-
 Singapore
-
 Slovakia
-
 Slovenia
-
 Somalia
-
 South Africa
-
 Spain
Spain
-
 Sri Lanka
-
 Sweden
-
 Switzerland
-
 Syria
Syria
-
 Taiwan
-
 Tajikistan
-
 Tanzania
-
 Thailand
-
 Trinidad and Tobago
-
 Tunisia
-
 Turkey
-
 UAE
UAE
-
 Uganda
-
 Ukraine
-
 United Kingdom
-
United States
-
 Uruguay
-
 Uzbekistan
-
 Venezuela
-
 Vietnam
-
 Yemen
Yemen
-
 Zambia
-
 Zimbabwe
- Forex
- Crypto
