
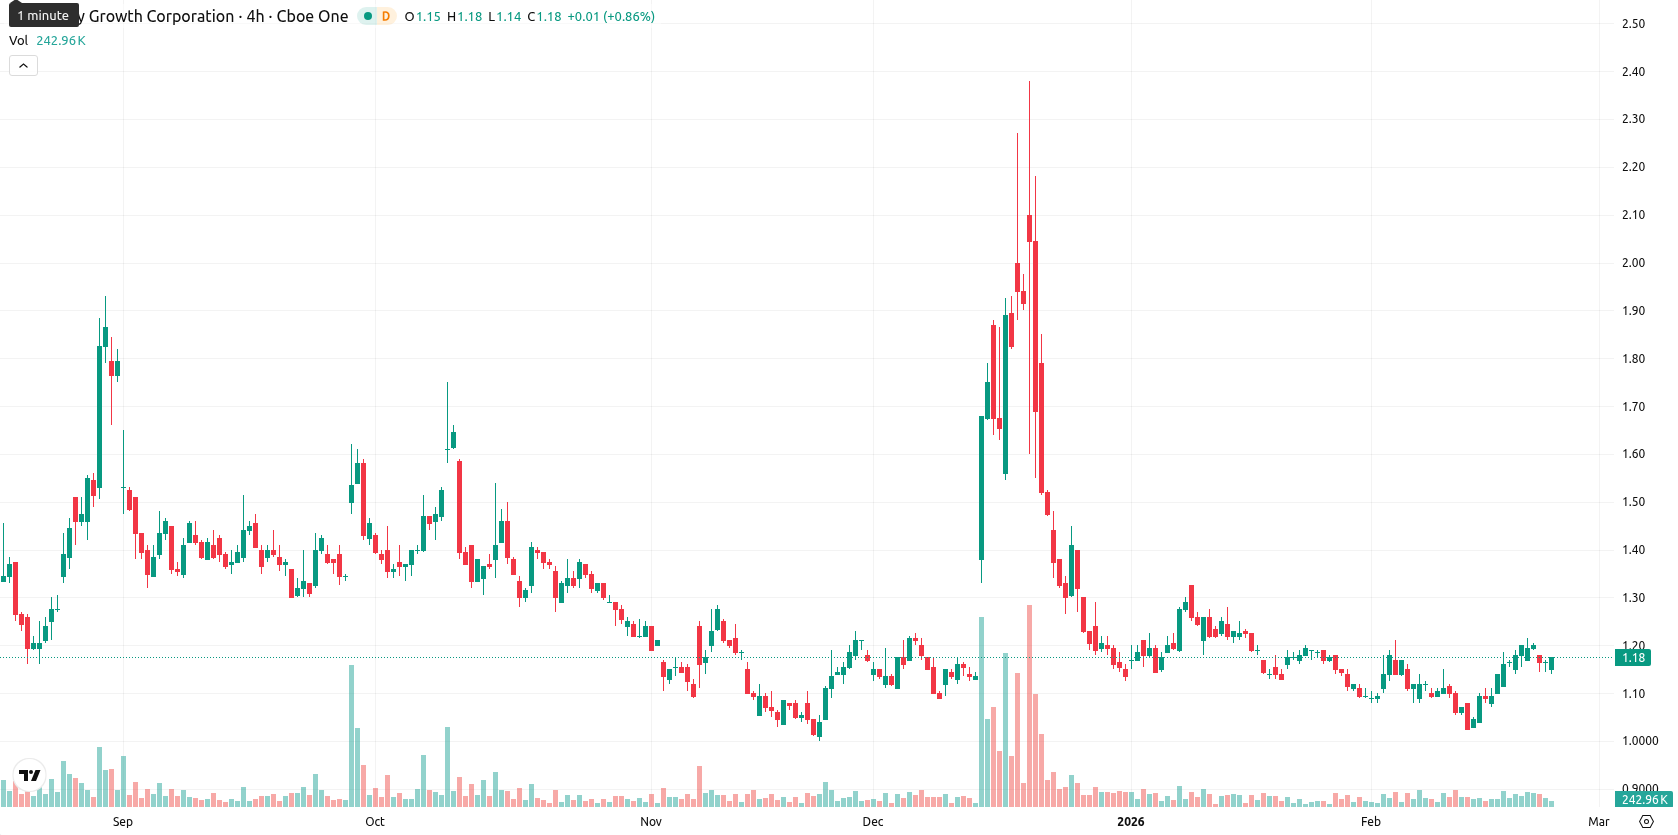
+3.48% for Canopy Growth stock — price hovers near session highs despite weak trend strength

Canopy Growth Corporation (CGC) is currently quoted at $1.19, which is above the MA-20 ($1.12), just under the MA-50 ($1.24), and well beneath the MA-200 ($1.30). This structure highlights short-term bullish momentum versus persistent medium- and long-term selling pressure, while the Ichimoku Kijun at $1.14 offers immediate support.
Highlights
- The $1.19 price sits above the MA-20 ($1.12) but below the MA-50 ($1.24) and MA-200 ($1.30), highlighting ongoing medium- and long-term selling pressure despite short-term bullishness.
- Momentum indicators are mixed: MACD and ADX signal weak or negative momentum, while RSI and CCI are neutral to mildly positive, and Stochastic RSI is strongly overbought.
- Weekly indicators suggest a less than 20% chance of a sustained rally, with expected price action consolidating between $1.13–$1.22; a bearish breakdown below $1.13 risks further downside.
Divergent oscillators and muted trend strength shape uncertain outlook
Momentum signals are divided. The MACD and ADX on the daily both indicate lackluster or negative momentum, suggesting weak trend strength. Meanwhile, the RSI ($1.19) and CCI remain neutral to mildly positive, and the Stochastic RSI is signaling strong overbought conditions. Bull/Bear Power points to slight buyer dominance intraday. The daily session opened narrowly (previous close $1.15, today’s open $1.14) and is now trading near the day’s high, showing modest volatility and support for intraday strength. Persistent divergence between oscillators and trend signals reflects an unclear technical picture.
Limited upside as range-bound consolidation persists amid bearish bias
In the short term, the typical volatility band for CGC is expected between $1.13 and $1.22. The weekly chart trend indicators are predominantly bearish except for the RSI, so there is less than a 20% chance of a sustained upside move. The baseline scenario is for price to consolidate within this range. A breakout above $1.22 could lead to a challenge of higher resistance, while a drop below $1.13 would point to renewed selling and lower support levels.
Last time, analysts noted that Canopy Growth Corporation is trading above its 20-day moving average, indicating short-term bullish momentum, but remains below its 50- and 200-day moving averages, reflecting ongoing medium- and long-term selling pressure. Divergent momentum signals, with weak MACD and ADX trends alongside overbought oscillator readings, suggest limited conviction and potential for consolidation between key support near $1.14 and resistance around $1.24.


Latest Canopy Growth News


-
 Afghanistan
-
 Albania
-
 Algeria
-
 Angola
-
 Argentina
-
 Armenia
-
 Australia
-
 Austria
-
 Azerbaijan
-
 Bahamas
-
 Bahrain
-
 Bangladesh
-
 Belarus
-
 Belgium
-
 Bolivia
-
 Botswana
-
 Brazil
-
 Brunei
-
 Bulgaria
-
 Cambodia
-
 Cameroon
-
 Canada
-
 Chile
Chile
-
 China
China
-
 Colombia
-
 Congo
Congo
-
 Costa Rica
-
 Cote d'Ivoire
-
 Croatia
-
 Cuba
Cuba
-
 Cyprus
-
 Czechia
-
 DR Congo
-
 Denmark
-
 Dominican Republic
-
 Ecuador
-
 Egypt
Egypt
-
 El Salvador
-
 Estonia
-
 Eswatini
-
 Ethiopia
-
 Finland
-
 France
-
 Georgia
-
 Germany
-
 Ghana
Ghana
-
 Greece
-
 Haiti
Haiti
-
 Hong Kong
-
 Hungary
-
 India
India
-
 Indonesia
-
 Iran, Islamic republic
-
 Iraq
Iraq
-
 Ireland
-
 Israel
-
 Italy
Italy
-
 Jamaica
-
 Japan
Japan
-
 Jordan
-
 Kazakhstan
-
 Kenya
Kenya
-
 Korea
Korea
-
 Kuwait
-
 Kyrgyzstan
-
 Laos
Laos
-
 Latvia
-
 Lebanon
-
 Lesotho
-
 Libya
Libya
-
 Lithuania
-
 Luxembourg
-
 Madagascar
-
 Malaysia
-
 Malta
Malta
-
 Mauritius
-
 Mexico
-
 Moldova
-
 Mongolia
-
 Montenegro
-
 Morocco
-
 Mozambique
-
 Myanmar
-
 Namibia
-
 Nepal
Nepal
-
 Netherlands
-
 New Zealand
-
 Nigeria
-
 North Macedonia
-
 Norway
-
 Oman
Oman
-
 Pakistan
-
 Palestine
-
 Panama
-
 Papua New Guinea
-
 Paraguay
-
 Peru
Peru
-
 Philippines
-
 Poland
-
 Portugal
-
 Puerto Rico
-
 Qatar
Qatar
-
 Reunion
-
 Romania
-
 Rwanda
-
 Saudi Arabia
-
 Serbia
-
 Singapore
-
 Slovakia
-
 Slovenia
-
 Somalia
-
 South Africa
-
 Spain
Spain
-
 Sri Lanka
-
 Sweden
-
 Switzerland
-
 Syria
Syria
-
 Taiwan
-
 Tajikistan
-
 Tanzania
-
 Thailand
-
 Trinidad and Tobago
-
 Tunisia
-
 Turkey
-
 UAE
UAE
-
 Uganda
-
 Ukraine
-
 United Kingdom
-
United States
-
 Uruguay
-
 Uzbekistan
-
 Venezuela
-
 Vietnam
-
 Yemen
Yemen
-
 Zambia
-
 Zimbabwe
- Forex
- Crypto
