
Meta shows soft momentum while stablecoin initiative with Stripe seeks to balance weak chart signals – weekly report

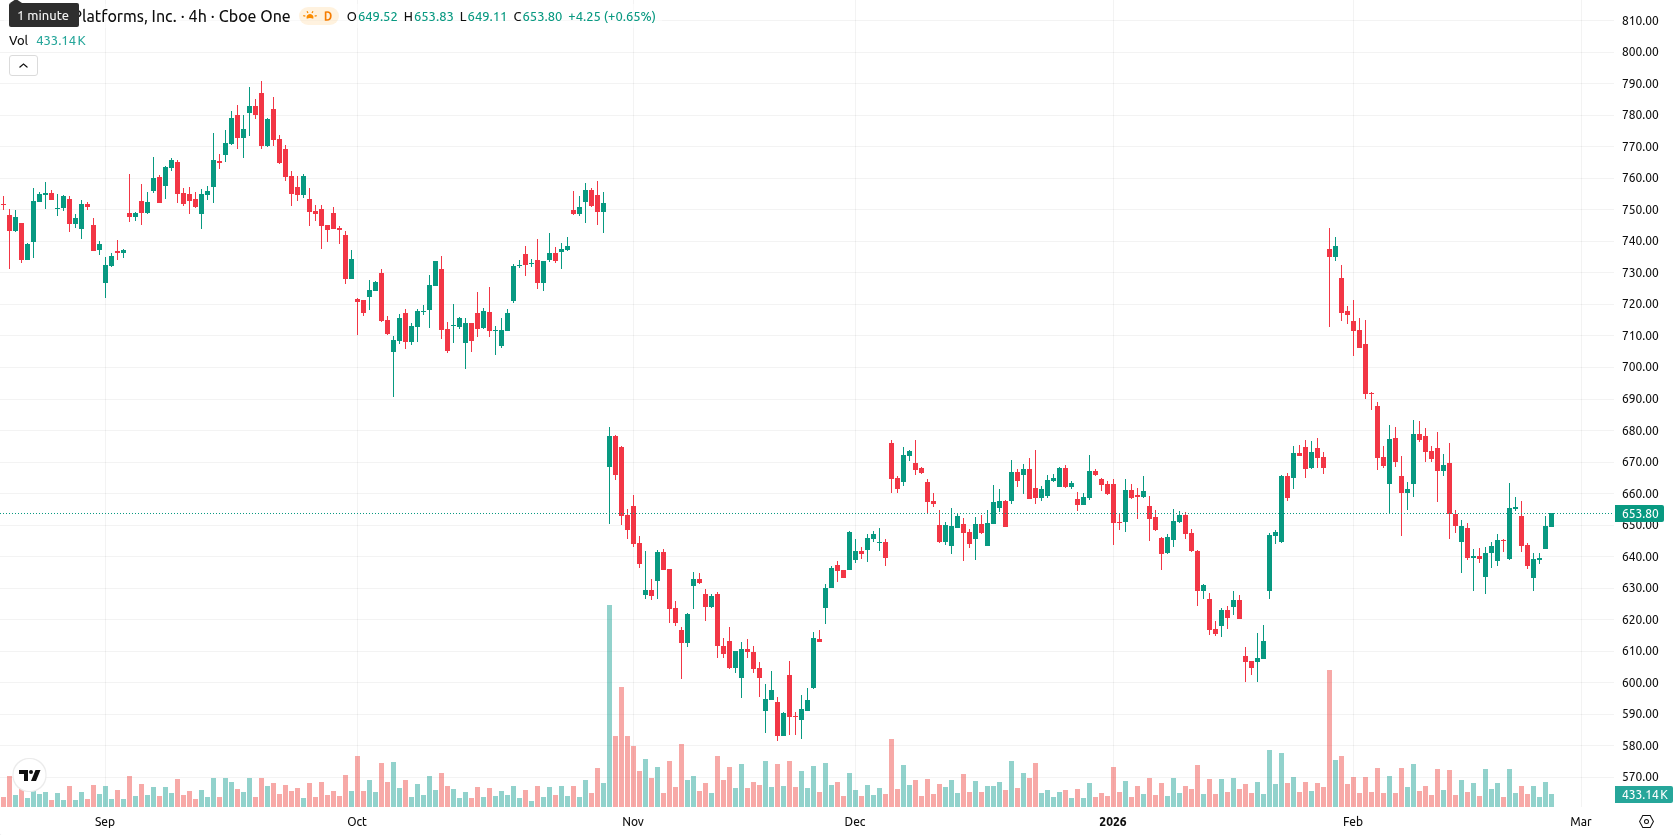
Meta Platforms, Inc. (META, formerly Facebook) is currently trading at $647.99, registering a weekly loss of $5.47 or 0.84%. The price has dipped below its 20-, 50-, and 200-week moving averages, indicating both short-term and long-term weakness and placing the asset in a position of technical pressure relative to these key trend indicators.
Highlights
- META is trading at $647.99, below the MA-20 ($667.11), MA-50 ($656.47), and MA-200 ($690.94), signaling short- and long-term weakness.
- Key technical resistances are at the MA-50 ($656.47) and the Ichimoku Kijun ($672.00); immediate support is near $642.
- Technical indicators point to selling momentum and a likely sideways to lower move, with a 5-day expected range of $633–$668 and under 20% probability of price increase.
Stablecoin initiative lifts sentiment amid US regulatory clarity
Meta has announced a new stablecoin initiative in partnership with Stripe, aiming to launch digital payments across WhatsApp, Instagram, and Facebook. This move follows greater US regulatory clarity after the GENIUS Act defined 'payment stablecoins' and established AML requirements. Stripe’s recent national trust bank charter and its CEO's appointment to Meta’s board are expected to reinforce the stability and reach of this initiative.
Downward momentum persists as technical resistance caps weekly recovery
On the weekly chart, META remains below the MA-20 ($667.11), MA-50 ($656.47), and MA-200 ($690.94), highlighting sustained downward pressure and resistance at the MA-50 and Ichimoku Kijun ($672.00). Weekly technical indicators present a soft outlook: the MACD suggests selling momentum, with the ADX emphasizing a weak trend, while RSI and Stochastic RSI hover in neutral to mildly overbought territory. The Commodity Channel Index reveals slight weakness, and despite pockets of intraday buyer activity, broader weekly momentum remains negative.
Consolidation expected as resistance holds and upside risks remain muted
Over the next five to seven trading days, META is expected to consolidate within a range of $633 to $668, with the probability of a sustained price increase assessed at below 20%. The prevailing scenario favors sideways trading under continued technical resistance. Should the price break above $656.47 and consolidate over $672.00, a bullish reversal may emerge, while a drop below $642 could trigger further decline.
Previously it was reported that Meta Platforms Inc. is trading below key short-, medium-, and long-term moving averages, with price action remaining under the 20-, 50-, and 200-day averages, and immediate resistance identified near the Ichimoku Kijun level at $672. Technical indicators such as MACD, ADX, RSI, and CCI reflect weak momentum and mild bearishness despite intraday buying strength, suggesting a continued downside bias with consolidation expected within the projected range.


Latest META News


-
 Afghanistan
-
 Albania
-
 Algeria
-
 Angola
-
 Argentina
-
 Armenia
-
 Australia
-
 Austria
-
 Azerbaijan
-
 Bahamas
-
 Bahrain
-
 Bangladesh
-
 Belarus
-
 Belgium
-
 Bolivia
-
 Botswana
-
 Brazil
-
 Brunei
-
 Bulgaria
-
 Cambodia
-
 Cameroon
-
 Canada
-
 Chile
Chile
-
 China
China
-
 Colombia
-
 Congo
Congo
-
 Costa Rica
-
 Cote d'Ivoire
-
 Croatia
-
 Cuba
Cuba
-
 Cyprus
-
 Czechia
-
 DR Congo
-
 Denmark
-
 Dominican Republic
-
 Ecuador
-
 Egypt
Egypt
-
 El Salvador
-
 Estonia
-
 Eswatini
-
 Ethiopia
-
 Finland
-
 France
-
 Georgia
-
 Germany
-
 Ghana
Ghana
-
 Greece
-
 Haiti
Haiti
-
 Hong Kong
-
 Hungary
-
 India
India
-
 Indonesia
-
 Iran, Islamic republic
-
 Iraq
Iraq
-
 Ireland
-
 Israel
-
 Italy
Italy
-
 Jamaica
-
 Japan
Japan
-
 Jordan
-
 Kazakhstan
-
 Kenya
Kenya
-
 Korea
Korea
-
 Kuwait
-
 Kyrgyzstan
-
 Laos
Laos
-
 Latvia
-
 Lebanon
-
 Lesotho
-
 Libya
Libya
-
 Lithuania
-
 Luxembourg
-
 Madagascar
-
 Malaysia
-
 Malta
Malta
-
 Mauritius
-
 Mexico
-
 Moldova
-
 Mongolia
-
 Montenegro
-
 Morocco
-
 Mozambique
-
 Myanmar
-
 Namibia
-
 Nepal
Nepal
-
 Netherlands
-
 New Zealand
-
 Nigeria
-
 North Macedonia
-
 Norway
-
 Oman
Oman
-
 Pakistan
-
 Palestine
-
 Panama
-
 Papua New Guinea
-
 Paraguay
-
 Peru
Peru
-
 Philippines
-
 Poland
-
 Portugal
-
 Puerto Rico
-
 Qatar
Qatar
-
 Reunion
-
 Romania
-
 Rwanda
-
 Saudi Arabia
-
 Serbia
-
 Singapore
-
 Slovakia
-
 Slovenia
-
 Somalia
-
 South Africa
-
 Spain
Spain
-
 Sri Lanka
-
 Sweden
-
 Switzerland
-
 Syria
Syria
-
 Taiwan
-
 Tajikistan
-
 Tanzania
-
 Thailand
-
 Trinidad and Tobago
-
 Tunisia
-
 Turkey
-
 UAE
UAE
-
 Uganda
-
 Ukraine
-
 United Kingdom
-
United States
-
 Uruguay
-
 Uzbekistan
-
 Venezuela
-
 Vietnam
-
 Yemen
Yemen
-
 Zambia
-
 Zimbabwe
- Forex
- Crypto
