
Affirm stock slips as bearish momentum dominates despite new merchant partnerships

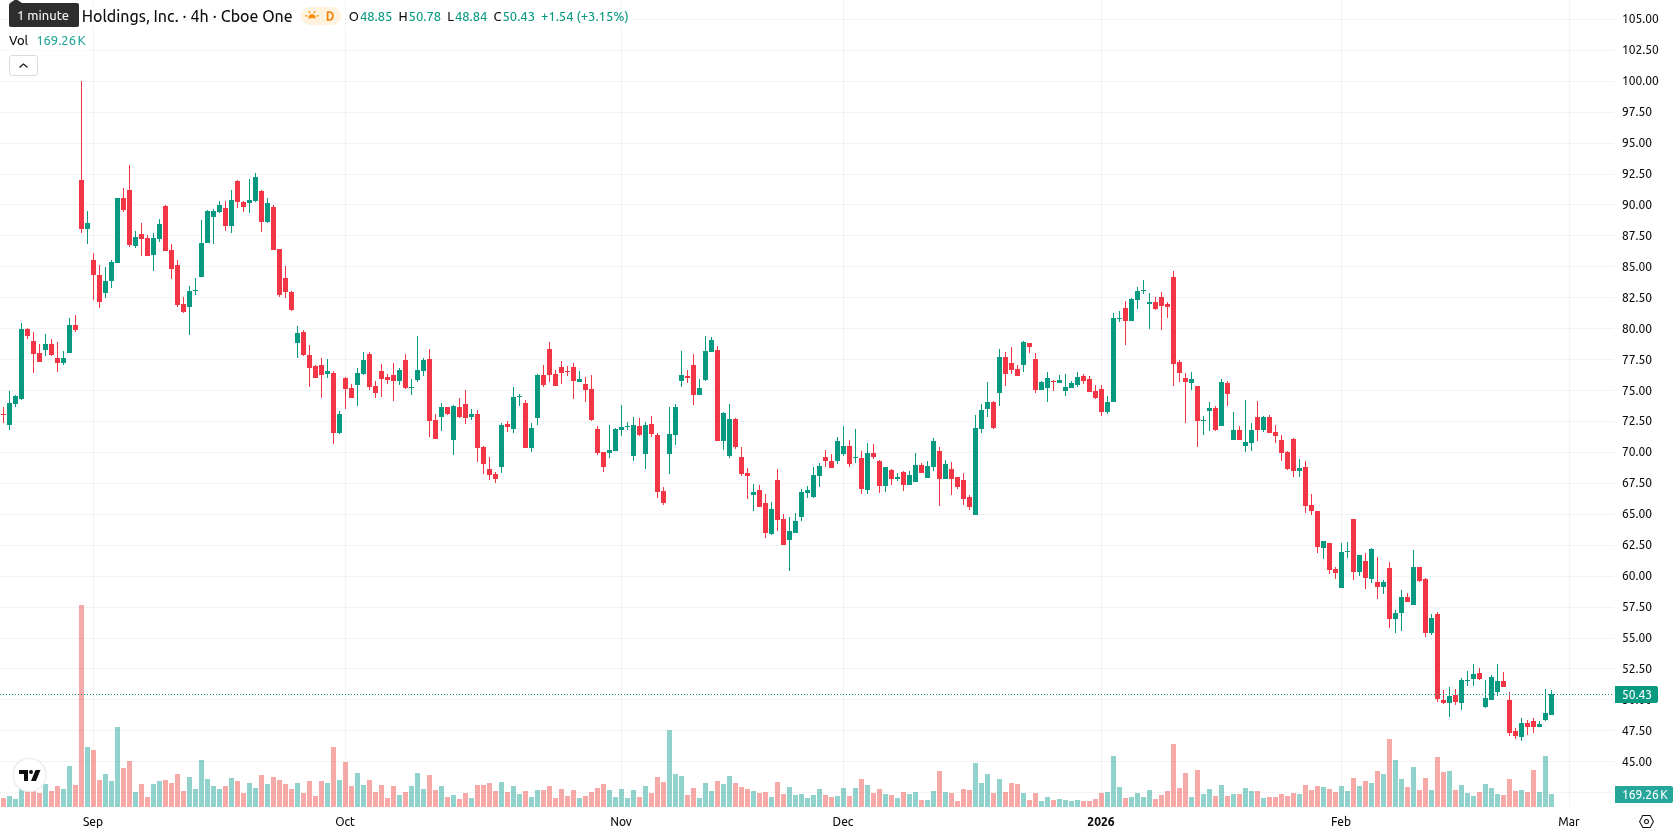
Affirm Holdings, Inc. (AFRM) is trading at $48.73, marking a daily decline of 3.35%. The asset remains well below its MA-20, MA-50, and MA-200, highlighting sustained selling pressure relative to key moving averages.
Highlights
- Affirm reported a 42% year-over-year increase in merchant partnerships for Q2 2026 but guided for potential slowdown in gross merchandise volume and steady margins.
- New partnerships enable Canadian clients to pay H&R Block Canada in installments and provide U.S. Lowe’s customers with flexible payment options, while shares remain under selling pressure.
- Affirm ($48.73) trades well below its MA-20 ($54.93), MA-50 ($66.79), and MA-200 ($69.34), with immediate resistance at $60.40 and a near-term bearish bias suggesting risk of further decline toward $44.00.
Merchant partnership growth amid guidance for softer gross volume
On February 26, 2026, Affirm reported its Q2 2026 earnings, which noted a 42% year-over-year increase in merchant partnerships. The results indicated guidance for a potential slowdown in gross merchandise volume and steady margins. The company also announced new partnerships, enabling Canadian clients to pay H&R Block Canada tax preparation fees in installments and providing Lowe’s customers in the US with flexible payment options, though price action has remained under broader selling pressure.
Momentum divergence as negative signals and oversold risk build
Momentum indicators on the daily timeframe remain negative for AFRM, with the MACD showing strong sell signals and the ADX at 27.19 indicating a solid downward trend. RSI is at 34.32 and the Commodity Channel Index signals further weakness, suggesting that the stock is approaching oversold territory. The Stochastic RSI remains overbought, reflecting a divergence between classic and fast oscillators, while Bull/Bear Power confirms seller dominance intraday. The price gapped down at the open and currently trades near the lower half of today’s range of $48.29 – $50.82, with the Ichimoku Kijun at $60.40 acting as immediate resistance.
Bearish scenario likely as downside risk outweighs rebound odds
Over the next five trading days, AFRM is expected to trade within a typical volatility band between $44.00 and $52.00. The probability of an upward move is low, at under 20%, making further decline the more likely scenario. Sideways movement within this range is the baseline expectation unless a breakout above $52.00 and the Ichimoku Kijun occurs. Should current downward momentum persist, a drop below $44.00 would confirm a bearish scenario.
Last time, analysts noted that Affirm Holdings, Inc. is trading below key moving averages, with technical indicators such as the MACD and ADX confirming persistent negative momentum, while RSI and CCI reflect oversold conditions. The stock is expected to continue sideways within a defined range as near-term upside appears limited, with $60.40 as key resistance and $46.00 as critical support.


Latest Affirm News


-
 Afghanistan
-
 Albania
-
 Algeria
-
 Angola
-
 Argentina
-
 Armenia
-
 Australia
-
 Austria
-
 Azerbaijan
-
 Bahamas
-
 Bahrain
-
 Bangladesh
-
 Belarus
-
 Belgium
-
 Bolivia
-
 Botswana
-
 Brazil
-
 Brunei
-
 Bulgaria
-
 Cambodia
-
 Cameroon
-
 Canada
-
 Chile
Chile
-
 China
China
-
 Colombia
-
 Congo
Congo
-
 Costa Rica
-
 Cote d'Ivoire
-
 Croatia
-
 Cuba
Cuba
-
 Cyprus
-
 Czechia
-
 DR Congo
-
 Denmark
-
 Dominican Republic
-
 Ecuador
-
 Egypt
Egypt
-
 El Salvador
-
 Estonia
-
 Eswatini
-
 Ethiopia
-
 Finland
-
 France
-
 Georgia
-
 Germany
-
 Ghana
Ghana
-
 Greece
-
 Haiti
Haiti
-
 Hong Kong
-
 Hungary
-
 India
India
-
 Indonesia
-
 Iran, Islamic republic
-
 Iraq
Iraq
-
 Ireland
-
 Israel
-
 Italy
Italy
-
 Jamaica
-
 Japan
Japan
-
 Jordan
-
 Kazakhstan
-
 Kenya
Kenya
-
 Korea
Korea
-
 Kuwait
-
 Kyrgyzstan
-
 Laos
Laos
-
 Latvia
-
 Lebanon
-
 Lesotho
-
 Libya
Libya
-
 Lithuania
-
 Luxembourg
-
 Madagascar
-
 Malaysia
-
 Malta
Malta
-
 Mauritius
-
 Mexico
-
 Moldova
-
 Mongolia
-
 Montenegro
-
 Morocco
-
 Mozambique
-
 Myanmar
-
 Namibia
-
 Nepal
Nepal
-
 Netherlands
-
 New Zealand
-
 Nigeria
-
 North Macedonia
-
 Norway
-
 Oman
Oman
-
 Pakistan
-
 Palestine
-
 Panama
-
 Papua New Guinea
-
 Paraguay
-
 Peru
Peru
-
 Philippines
-
 Poland
-
 Portugal
-
 Puerto Rico
-
 Qatar
Qatar
-
 Reunion
-
 Romania
-
 Rwanda
-
 Saudi Arabia
-
 Serbia
-
 Singapore
-
 Slovakia
-
 Slovenia
-
 Somalia
-
 South Africa
-
 Spain
Spain
-
 Sri Lanka
-
 Sweden
-
 Switzerland
-
 Syria
Syria
-
 Taiwan
-
 Tajikistan
-
 Tanzania
-
 Thailand
-
 Trinidad and Tobago
-
 Tunisia
-
 Turkey
-
 UAE
UAE
-
 Uganda
-
 Ukraine
-
 United Kingdom
-
United States
-
 Uruguay
-
 Uzbekistan
-
 Venezuela
-
 Vietnam
-
 Yemen
Yemen
-
 Zambia
-
 Zimbabwe
- Forex
- Crypto
