

Tesla stock: Operational headwinds and bearish signals fuel continued price softness

Tesla, Inc. (TSLA) is trading at $404.73, slipping 0.86% on the day. The price remains below the MA-20 ($414.55) and MA-50 ($437.59), but stays above the MA-200 ($390.23), signaling continued short- and medium-term selling pressure with long-term support still intact. Immediate resistance is noted at the Ichimoku Kijun level of $419.97.
TSLA price prediction
Current price:
$377.89
-5.1200
1.34%
Closed
10/12
Daily range
377.68
 382.41
382.41
Weekly range
368.27
388.12
388.12
Loading...
Highlights
- Tesla reported its thirteenth consecutive month of declining European sales but reached a resolution with IG Metall, stabilizing Berlin operations.
- Tesla continues to leverage Nvidia’s computing technology for robotics and autonomous vehicle development, according to Nvidia’s latest earnings disclosure.
- Tesla’s price at $404.73 is under key moving averages (MA-20 $414.55, MA-50 $437.59), with bearish momentum indicators and immediate resistance at $419.97 suggesting ongoing seller pressure.
Sustained seller activity amid operational challenges and leadership change
Tesla continued to report operational setbacks in Europe, recording its thirteenth consecutive month of declining regional sales while resolving a labor dispute with IG Metall at its Berlin facility, which improved stability. Internal changes included the departure of Victor Nechita from the Cybercab initiative, ahead of the planned robo-taxi launch. Tesla remained a key client for Nvidia, utilizing its computing technology for robotics and autonomous vehicle development, as outlined in Nvidia's most recent earnings disclosure. These developments have emerged alongside persistent seller activity.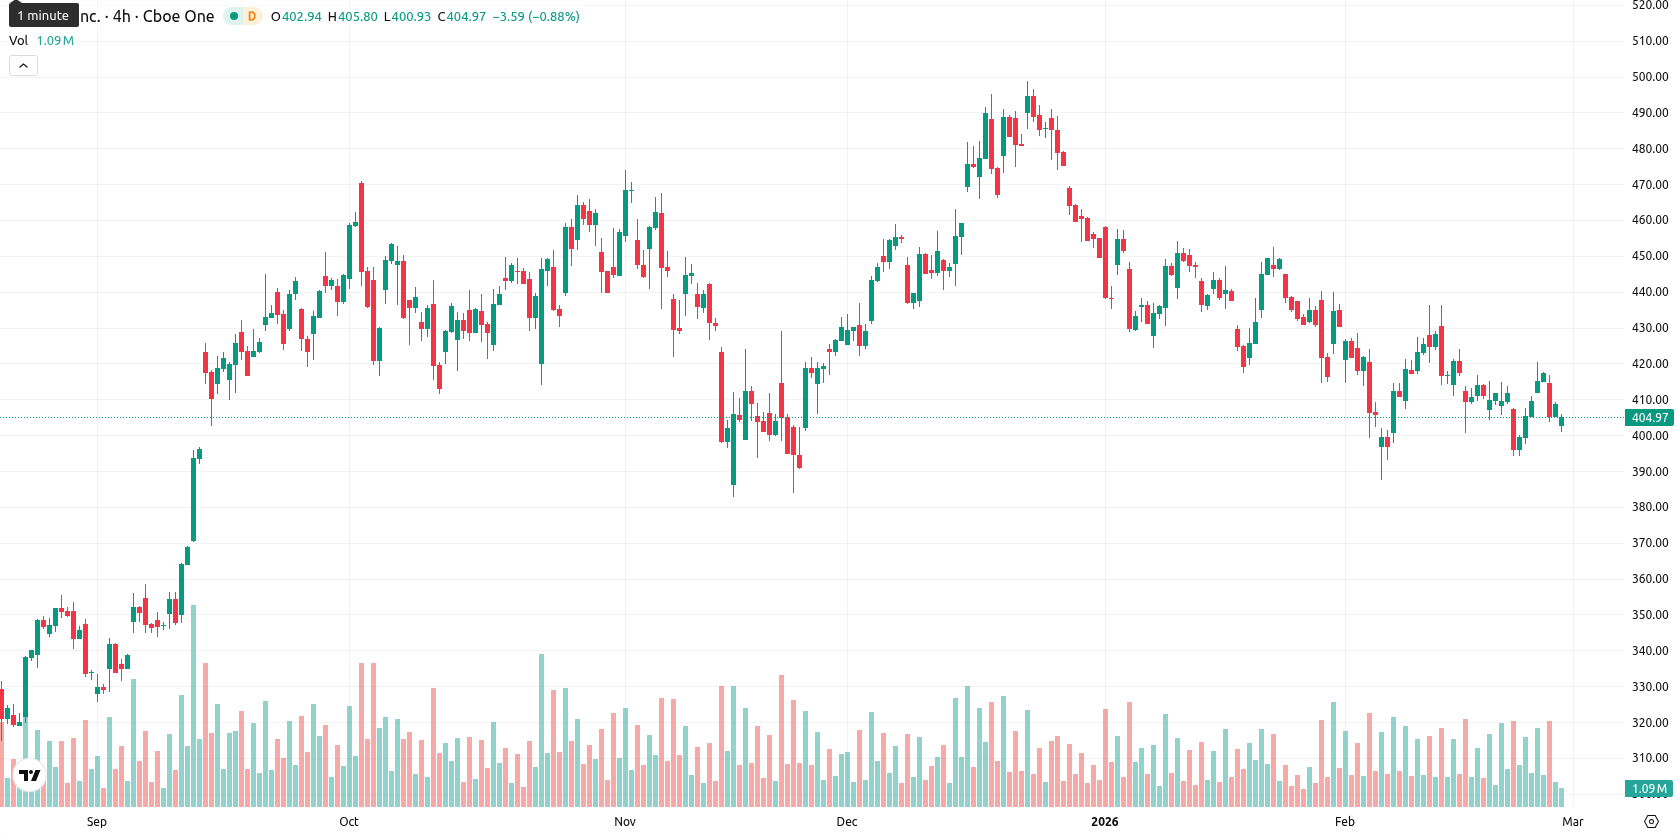
Bearish momentum dominates as technical signals converge with weak trend
Technical signals for TSLA are predominantly bearish. The MACD triggers a strong sell, with the ADX reading of 19.15 reflecting weak trend strength. The RSI and Stochastic RSI continue to point toward selling momentum without a clear overbought or oversold condition, and the Commodity Channel Index is neutral. Bull/Bear Power is in overbought territory, though momentum across timeframes shows sellers have the upper hand intraday, and the Awesome Oscillator is neutral. The current session shows a mild move lower with low intraday volatility, confirming modest seller pressure after the open. Most oscillators align with the downward trend, but Bull/Bear Power's reading highlights some mixed signals on short-term sentiment.Sideways trading expected as resistance and weak bullish signals limit upside
In the next week, TSLA is expected to remain within a typical volatility band between $397.00 and $410.00, close to current levels. The probability of a near-term price increase is low (below 20%), as only the weekly MA-50 suggests a possible move higher, while RSI, ADX, and MACD show little support for upward movement. The baseline scenario is continued sideways action in this range. A break above immediate resistance at the Ichimoku Kijun ($419.97) could trigger a move higher, while a sustained decline below $397.00 would likely bring a test of long-term support at the MA-200.
Anton Kharitonov, expert at Traders Union, sees TSLA trapped in a period of weak trend and selling pressure. The stock faces operational headwinds in Europe and muted technical signals, with resistance parked just above at $419.97. He believes sellers remain in control while sideways action is the base scenario unless this resistance breaks. "For now, I remain defensive and expect continued consolidation between $397.00 and $410.00 until buyers show clear momentum."
Previously it was reported that Tesla shares remain under bearish pressure, consolidating within a $380–$450 range as momentum compresses, with the 50-day moving average just above current levels and the 200-day below, while RSI indicates neutral conditions. Key support is near $380 and resistance in the $440–$450 zone, with upside moves lacking conviction and a breakout above $450 required to re-establish a bullish outlook.
Source of Data:
TSLA Price Analysis by TU
The analysis is based on a proprietary model combining technical, on-chain, and expert data. Not investment advice. See
methodology
The information is based on forecasts and does not constitute investment advice or a guarantee of future results. Market conditions may change. See our Disclaimer and Editorial Integrity for details.
Subscribe to TU news


Did you like the article?






Top News


Top 5 companies for you

United States
-
 Afghanistan
-
 Albania
-
 Algeria
-
 Angola
-
 Argentina
-
 Armenia
-
 Australia
-
 Austria
-
 Azerbaijan
-
 Bahamas
-
 Bahrain
-
 Bangladesh
-
 Belarus
-
 Belgium
-
 Bolivia
-
 Botswana
-
 Brazil
-
 Brunei
-
 Bulgaria
-
 Cambodia
-
 Cameroon
-
 Canada
-
 Chile
Chile
-
 China
China
-
 Colombia
-
 Congo
Congo
-
 Costa Rica
-
 Cote d'Ivoire
-
 Croatia
-
 Cuba
Cuba
-
 Cyprus
-
 Czechia
-
 DR Congo
-
 Denmark
-
 Dominican Republic
-
 Ecuador
-
 Egypt
Egypt
-
 El Salvador
-
 Estonia
-
 Eswatini
-
 Ethiopia
-
 Finland
-
 France
-
 Georgia
-
 Germany
-
 Ghana
Ghana
-
 Greece
-
 Haiti
Haiti
-
 Hong Kong
-
 Hungary
-
 India
India
-
 Indonesia
-
 Iran, Islamic republic
-
 Iraq
Iraq
-
 Ireland
-
 Israel
-
 Italy
Italy
-
 Jamaica
-
 Japan
Japan
-
 Jordan
-
 Kazakhstan
-
 Kenya
Kenya
-
 Korea
Korea
-
 Kuwait
-
 Kyrgyzstan
-
 Laos
Laos
-
 Latvia
-
 Lebanon
-
 Lesotho
-
 Libya
Libya
-
 Lithuania
-
 Luxembourg
-
 Madagascar
-
 Malaysia
-
 Malta
Malta
-
 Mauritius
-
 Mexico
-
 Moldova
-
 Mongolia
-
 Montenegro
-
 Morocco
-
 Mozambique
-
 Myanmar
-
 Namibia
-
 Nepal
Nepal
-
 Netherlands
-
 New Zealand
-
 Nigeria
-
 North Macedonia
-
 Norway
-
 Oman
Oman
-
 Pakistan
-
 Palestine
-
 Panama
-
 Papua New Guinea
-
 Paraguay
-
 Peru
Peru
-
 Philippines
-
 Poland
-
 Portugal
-
 Puerto Rico
-
 Qatar
Qatar
-
 Reunion
-
 Romania
-
 Rwanda
-
 Saudi Arabia
-
 Serbia
-
 Singapore
-
 Slovakia
-
 Slovenia
-
 Somalia
-
 South Africa
-
 Spain
Spain
-
 Sri Lanka
-
 Sweden
-
 Switzerland
-
 Syria
Syria
-
 Taiwan
-
 Tajikistan
-
 Tanzania
-
 Thailand
-
 Trinidad and Tobago
-
 Tunisia
-
 Turkey
-
 UAE
UAE
-
 Uganda
-
 Ukraine
-
 United Kingdom
-
United States
-
 Uruguay
-
 Uzbekistan
-
 Venezuela
-
 Vietnam
-
 Yemen
Yemen
-
 Zambia
-
 Zimbabwe
- Forex
- Crypto










Live News


