
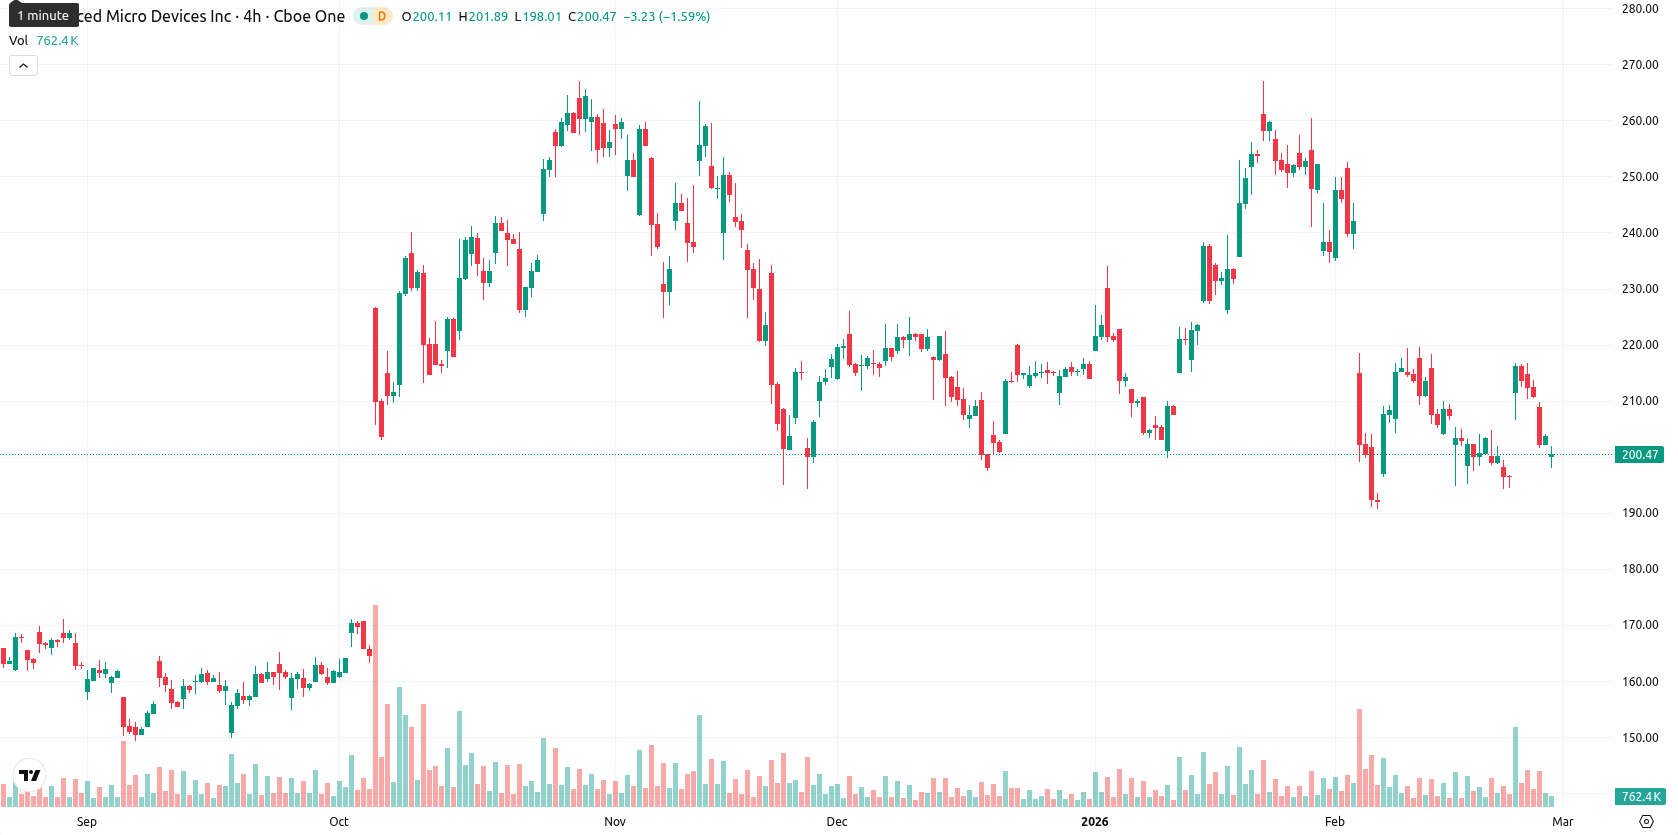
Heavy selling pressure dominates amid weak momentum signals — AMD stock slips 1.34%

Advanced Micro Devices, Inc. (AMD) is trading at $200.95, well below the MA-20 ($213.32) and MA-50 ($218.81), but above the MA-200 ($186.12). This indicates continued short- and medium-term pressure from sellers, while the long-term trend remains supported. The Ichimoku Kijun is at $228.81, which acts as immediate resistance at current levels.
Highlights
- AMD is trading at $200.95, below the MA-20 ($213.32) and MA-50 ($218.81), indicating ongoing short- and medium-term selling pressure.
- Momentum indicators, including MACD, RSI, and CCI, all signal a strong sell with the stock showing oversold conditions and weak directional strength according to ADX.
- Immediate resistance stands at the Ichimoku Kijun of $228.81, while near-term support is at $197.35; a move below this level could trigger further downside.
Bearish momentum and oversold conditions as sellers dominate early
Momentum remains weak, with the MACD signaling a strong sell and the ADX showing low directional strength, suggesting a lack of strong trend. The RSI and Commodity Channel Index are both indicating a sell, while the Stochastic RSI and Bull/Bear Power highlight oversold conditions and heavy dominance by sellers. The current price has declined $2.74, slipping 1.34% from the previous close, with today’s open ($199.89) only slightly below the last closing price — indicating no meaningful gap. Currently, price is mid-range for the day ($198.04 – $201.10), with moderate volatility and a clear tone of pressure after the open. Momentum and oscillator signals align, showing consistent short-term downside risk.
Further downside risk likely as sideways range caps upside potential
For the next five trading days, the likely range is $197.35 to $212.65, positioning the current price near the middle. The probability of a price increase is very low (less than 20%), while the chance of further decline is considerably more likely. The baseline scenario is sideways movement within the established corridor. A bullish breakthrough above resistance near $212.65 is unlikely in the current setup, while a bearish scenario would see a push below short-term support around $197.35, opening the door to further downside. Weekly moving averages remain supportive on longer timeframes, but near-term risks dominate for now.
Last time, analysts noted that Advanced Micro Devices, Inc. was trading below its 20- and 50-day moving averages but above the 200-day average, indicating short- and medium-term selling pressure while maintaining long-term trend support. Momentum signals remain mixed with continued downside volatility and seller dominance, while resistance is positioned near the Ichimoku Kijun level amid institutional repositioning related to AI partnerships.


Latest AMD News


-
 Afghanistan
-
 Albania
-
 Algeria
-
 Angola
-
 Argentina
-
 Armenia
-
 Australia
-
 Austria
-
 Azerbaijan
-
 Bahamas
-
 Bahrain
-
 Bangladesh
-
 Belarus
-
 Belgium
-
 Bolivia
-
 Botswana
-
 Brazil
-
 Brunei
-
 Bulgaria
-
 Cambodia
-
 Cameroon
-
 Canada
-
 Chile
Chile
-
 China
China
-
 Colombia
-
 Congo
Congo
-
 Costa Rica
-
 Cote d'Ivoire
-
 Croatia
-
 Cuba
Cuba
-
 Cyprus
-
 Czechia
-
 DR Congo
-
 Denmark
-
 Dominican Republic
-
 Ecuador
-
 Egypt
Egypt
-
 El Salvador
-
 Estonia
-
 Eswatini
-
 Ethiopia
-
 Finland
-
 France
-
 Georgia
-
 Germany
-
 Ghana
Ghana
-
 Greece
-
 Haiti
Haiti
-
 Hong Kong
-
 Hungary
-
 India
India
-
 Indonesia
-
 Iran, Islamic republic
-
 Iraq
Iraq
-
 Ireland
-
 Israel
-
 Italy
Italy
-
 Jamaica
-
 Japan
Japan
-
 Jordan
-
 Kazakhstan
-
 Kenya
Kenya
-
 Korea
Korea
-
 Kuwait
-
 Kyrgyzstan
-
 Laos
Laos
-
 Latvia
-
 Lebanon
-
 Lesotho
-
 Libya
Libya
-
 Lithuania
-
 Luxembourg
-
 Madagascar
-
 Malaysia
-
 Malta
Malta
-
 Mauritius
-
 Mexico
-
 Moldova
-
 Mongolia
-
 Montenegro
-
 Morocco
-
 Mozambique
-
 Myanmar
-
 Namibia
-
 Nepal
Nepal
-
 Netherlands
-
 New Zealand
-
 Nigeria
-
 North Macedonia
-
 Norway
-
 Oman
Oman
-
 Pakistan
-
 Palestine
-
 Panama
-
 Papua New Guinea
-
 Paraguay
-
 Peru
Peru
-
 Philippines
-
 Poland
-
 Portugal
-
 Puerto Rico
-
 Qatar
Qatar
-
 Reunion
-
 Romania
-
 Rwanda
-
 Saudi Arabia
-
 Serbia
-
 Singapore
-
 Slovakia
-
 Slovenia
-
 Somalia
-
 South Africa
-
 Spain
Spain
-
 Sri Lanka
-
 Sweden
-
 Switzerland
-
 Syria
Syria
-
 Taiwan
-
 Tajikistan
-
 Tanzania
-
 Thailand
-
 Trinidad and Tobago
-
 Tunisia
-
 Turkey
-
 UAE
UAE
-
 Uganda
-
 Ukraine
-
 United Kingdom
-
United States
-
 Uruguay
-
 Uzbekistan
-
 Venezuela
-
 Vietnam
-
 Yemen
Yemen
-
 Zambia
-
 Zimbabwe
- Forex
- Crypto
