
Core Scientific stock price forecast: Short-term selling pressure dominates as CORZ slips 7.09%

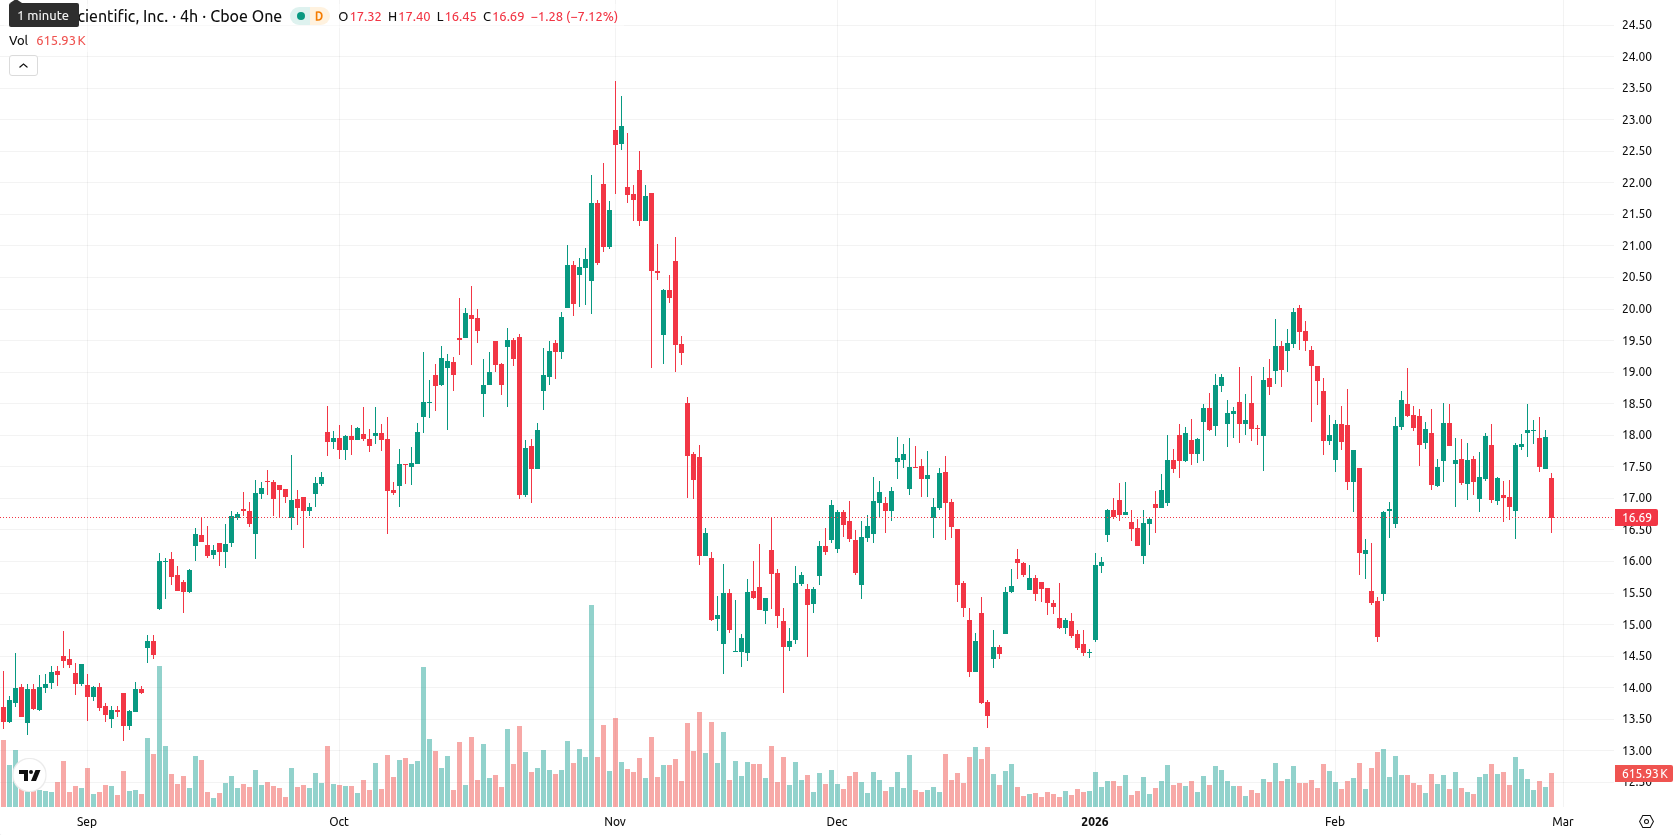
Core Scientific (CORZ) is trading at $16.71 after a sharp move down of 7.09% during the session. The price has slipped below both its 20-day ($17.55) and 50-day ($17.06) Moving Averages but remains above the 200-day Moving Average ($15.66), highlighting increased selling pressure in the short to medium term while the long-term uptrend still provides support.
Highlights
- Core Scientific is set to report quarterly earnings on March 2, 2026, a key date for forward guidance and financial updates.
- CoreWeave revised its full-year 2025 guidance after construction delays at its Denton, Texas facility managed with Core Scientific, adding to near-term uncertainty.
- Core Scientific ($16.71) now trades below its 20- and 50-day moving averages with immediate resistance at $17.38; price consolidation expected in the $16.00–$18.40 range.
Earnings outlook and construction delays drive sentiment shift
Core Scientific is scheduled to release its quarterly earnings on March 2, 2026. A secondary development is that in late 2025, CoreWeave adjusted its full-year guidance following construction delays at its Denton, Texas facility managed in partnership with Core Scientific. These updates come as price action has remained under broader selling pressure.
Divergent momentum signals as intraday volatility intensifies
Momentum indicators present a mixed picture: the MACD on the daily chart remains in "Buy" territory but is softening, while ADX signals a very weak trend. The Relative Strength Index is neutral at 52.61, with the Stochastic RSI flashing "Strong Sell" and the Commodity Channel Index in a neutral to mildly oversold state. Bull/Bear Power currently reads as overbought but shows signs that seller pressure has dominated intraday momentum. The Awesome Oscillator is neutral. There was a slight gap lower at the open, and the price is now near the bottom of today’s range after a sharp drop of 7.09%, reflecting high volatility and pronounced pressure following the weak open. Intraday dynamics are negative and largely confirm the pullback seen in oscillators, despite divergence in broader momentum signals.
Sideways bias expected as consolidation and breakout risks rise
For the coming week, an expected price range of $16.00 to $18.40 reflects typical volatility and closely brackets the current market level. The probability of a price increase is about 80%, with declines less likely. The baseline scenario is for consolidation sideways in a $16.00–$18.40 band. A bullish breakout above $17.38 could push price toward the upper end of the volatility band relative to current levels, while a break below $16.00 raises the risk of further downside toward long-term supports.
Last time, analysts noted that Core Scientific Inc. maintains a bullish structure across short, medium, and long-term timeframes, with price above key moving averages and dynamic support at the Ichimoku Kijun line, while immediate resistance is seen near the $18.00–$18.24 zone. Momentum indicators are mixed—MACD points to bullishness but low ADX and overbought oscillators suggest limited trend strength and potential for consolidation unless key support or resistance levels are breached.


Latest Core Scientific News


-
 Afghanistan
-
 Albania
-
 Algeria
-
 Angola
-
 Argentina
-
 Armenia
-
 Australia
-
 Austria
-
 Azerbaijan
-
 Bahamas
-
 Bahrain
-
 Bangladesh
-
 Belarus
-
 Belgium
-
 Bolivia
-
 Botswana
-
 Brazil
-
 Brunei
-
 Bulgaria
-
 Cambodia
-
 Cameroon
-
 Canada
-
 Chile
Chile
-
 China
China
-
 Colombia
-
 Congo
Congo
-
 Costa Rica
-
 Cote d'Ivoire
-
 Croatia
-
 Cuba
Cuba
-
 Cyprus
-
 Czechia
-
 DR Congo
-
 Denmark
-
 Dominican Republic
-
 Ecuador
-
 Egypt
Egypt
-
 El Salvador
-
 Estonia
-
 Eswatini
-
 Ethiopia
-
 Finland
-
 France
-
 Georgia
-
 Germany
-
 Ghana
Ghana
-
 Greece
-
 Haiti
Haiti
-
 Hong Kong
-
 Hungary
-
 India
India
-
 Indonesia
-
 Iran, Islamic republic
-
 Iraq
Iraq
-
 Ireland
-
 Israel
-
 Italy
Italy
-
 Jamaica
-
 Japan
Japan
-
 Jordan
-
 Kazakhstan
-
 Kenya
Kenya
-
 Korea
Korea
-
 Kuwait
-
 Kyrgyzstan
-
 Laos
Laos
-
 Latvia
-
 Lebanon
-
 Lesotho
-
 Libya
Libya
-
 Lithuania
-
 Luxembourg
-
 Madagascar
-
 Malaysia
-
 Malta
Malta
-
 Mauritius
-
 Mexico
-
 Moldova
-
 Mongolia
-
 Montenegro
-
 Morocco
-
 Mozambique
-
 Myanmar
-
 Namibia
-
 Nepal
Nepal
-
 Netherlands
-
 New Zealand
-
 Nigeria
-
 North Macedonia
-
 Norway
-
 Oman
Oman
-
 Pakistan
-
 Palestine
-
 Panama
-
 Papua New Guinea
-
 Paraguay
-
 Peru
Peru
-
 Philippines
-
 Poland
-
 Portugal
-
 Puerto Rico
-
 Qatar
Qatar
-
 Reunion
-
 Romania
-
 Rwanda
-
 Saudi Arabia
-
 Serbia
-
 Singapore
-
 Slovakia
-
 Slovenia
-
 Somalia
-
 South Africa
-
 Spain
Spain
-
 Sri Lanka
-
 Sweden
-
 Switzerland
-
 Syria
Syria
-
 Taiwan
-
 Tajikistan
-
 Tanzania
-
 Thailand
-
 Trinidad and Tobago
-
 Tunisia
-
 Turkey
-
 UAE
UAE
-
 Uganda
-
 Ukraine
-
 United Kingdom
-
United States
-
 Uruguay
-
 Uzbekistan
-
 Venezuela
-
 Vietnam
-
 Yemen
Yemen
-
 Zambia
-
 Zimbabwe
- Forex
- Crypto
