
AMD stock slumps 2.32% as sellers dominate after gap down and bearish signals emerge

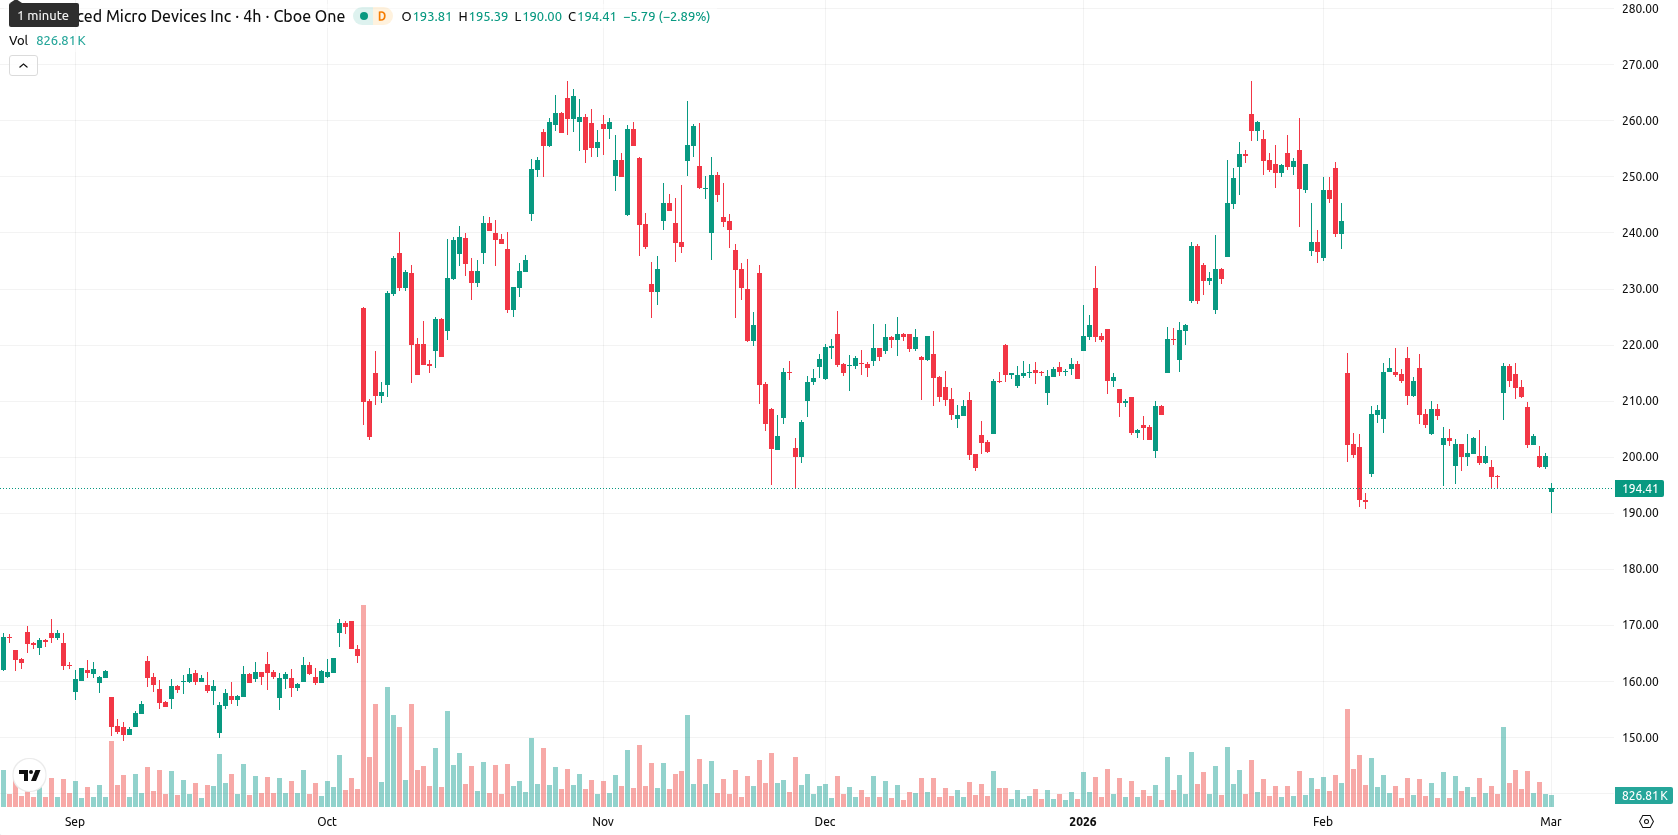
Advanced Micro Devices, Inc. (AMD) is trading at $195.57, well below the MA-20 ($210.73) and MA-50 ($218.67), but still above the MA-200 ($186.58). This positioning signals strong short- and medium-term downward pressure, while the long-term trend offers some support. The Ichimoku Kijun level is at $228.81, placing immediate resistance significantly above the current price.
Highlights
- AMD is trading at $195.57, significantly below its MA-20 ($210.73) and MA-50 ($218.67), reflecting strong short- and medium-term downward momentum.
- Technical indicators show weak momentum with the MACD on a strong sell signal, low-strength trend per ADX, and persistent seller dominance per Bull/Bear Power.
- Critical resistance stands at $206.00, with expected price action likely to consolidate between $187.00 and $206.00 over the next week; a break below $187.00 could drive deeper declines.
Weak momentum and persistent selling as oversold signals flash
Momentum remains weak, with the MACD indicating a strong sell and the ADX confirming a neutral but low-strength trend. Oversold readings from the Stochastic RSI and Commodity Channel Index suggest possible short-term relief, but the RSI still leans bearish and Bull/Bear Power highlights ongoing seller dominance. There was a gap down at the open, and AMD is currently priced near the upper end of today's range ($190.00 — $195.33) despite a daily decline of 2.32%. Intraday volatility is moderate, with pressure lingering after the open as downside momentum is broadly confirmed by the technical context.
Downside risk prevails as consolidation bands limit near-term upside
Over the next week, a typical volatility band is expected between $187.00 and $206.00. The probability of a price increase is very low (less than 20%), while a decline is more likely. The baseline scenario sees AMD continuing sideways in a consolidation range. A bullish scenario would require a strong move above $206.00 and retest of resistance levels, while further bearish movement below $187.00 could open the path for deeper declines if selling persists.
Last time, analysts noted that AMD shares are trading below short- and medium-term moving averages with bearish momentum, as key indicators (MACD, RSI, CCI) suggest sustained downside pressure and mild oversold conditions. The 200-day moving average remains a critical support level, while resistance at $228.81 and persistent high volatility reflect ongoing caution amid institutional outflows and sector-specific concerns.


Latest AMD News


-
 Afghanistan
-
 Albania
-
 Algeria
-
 Angola
-
 Argentina
-
 Armenia
-
 Australia
-
 Austria
-
 Azerbaijan
-
 Bahamas
-
 Bahrain
-
 Bangladesh
-
 Belarus
-
 Belgium
-
 Bolivia
-
 Botswana
-
 Brazil
-
 Brunei
-
 Bulgaria
-
 Cambodia
-
 Cameroon
-
 Canada
-
 Chile
Chile
-
 China
China
-
 Colombia
-
 Congo
Congo
-
 Costa Rica
-
 Cote d'Ivoire
-
 Croatia
-
 Cuba
Cuba
-
 Cyprus
-
 Czechia
-
 DR Congo
-
 Denmark
-
 Dominican Republic
-
 Ecuador
-
 Egypt
Egypt
-
 El Salvador
-
 Estonia
-
 Eswatini
-
 Ethiopia
-
 Finland
-
 France
-
 Georgia
-
 Germany
-
 Ghana
Ghana
-
 Greece
-
 Haiti
Haiti
-
 Hong Kong
-
 Hungary
-
 India
India
-
 Indonesia
-
 Iran, Islamic republic
-
 Iraq
Iraq
-
 Ireland
-
 Israel
-
 Italy
Italy
-
 Jamaica
-
 Japan
Japan
-
 Jordan
-
 Kazakhstan
-
 Kenya
Kenya
-
 Korea
Korea
-
 Kuwait
-
 Kyrgyzstan
-
 Laos
Laos
-
 Latvia
-
 Lebanon
-
 Lesotho
-
 Libya
Libya
-
 Lithuania
-
 Luxembourg
-
 Madagascar
-
 Malaysia
-
 Malta
Malta
-
 Mauritius
-
 Mexico
-
 Moldova
-
 Mongolia
-
 Montenegro
-
 Morocco
-
 Mozambique
-
 Myanmar
-
 Namibia
-
 Nepal
Nepal
-
 Netherlands
-
 New Zealand
-
 Nigeria
-
 North Macedonia
-
 Norway
-
 Oman
Oman
-
 Pakistan
-
 Palestine
-
 Panama
-
 Papua New Guinea
-
 Paraguay
-
 Peru
Peru
-
 Philippines
-
 Poland
-
 Portugal
-
 Puerto Rico
-
 Qatar
Qatar
-
 Reunion
-
 Romania
-
 Rwanda
-
 Saudi Arabia
-
 Serbia
-
 Singapore
-
 Slovakia
-
 Slovenia
-
 Somalia
-
 South Africa
-
 Spain
Spain
-
 Sri Lanka
-
 Sweden
-
 Switzerland
-
 Syria
Syria
-
 Taiwan
-
 Tajikistan
-
 Tanzania
-
 Thailand
-
 Trinidad and Tobago
-
 Tunisia
-
 Turkey
-
 UAE
UAE
-
 Uganda
-
 Ukraine
-
 United Kingdom
-
United States
-
 Uruguay
-
 Uzbekistan
-
 Venezuela
-
 Vietnam
-
 Yemen
Yemen
-
 Zambia
-
 Zimbabwe
- Forex
- Crypto
