
Microsoft gains 4.13% but weekly momentum indicators keep sellers in control – weekly review

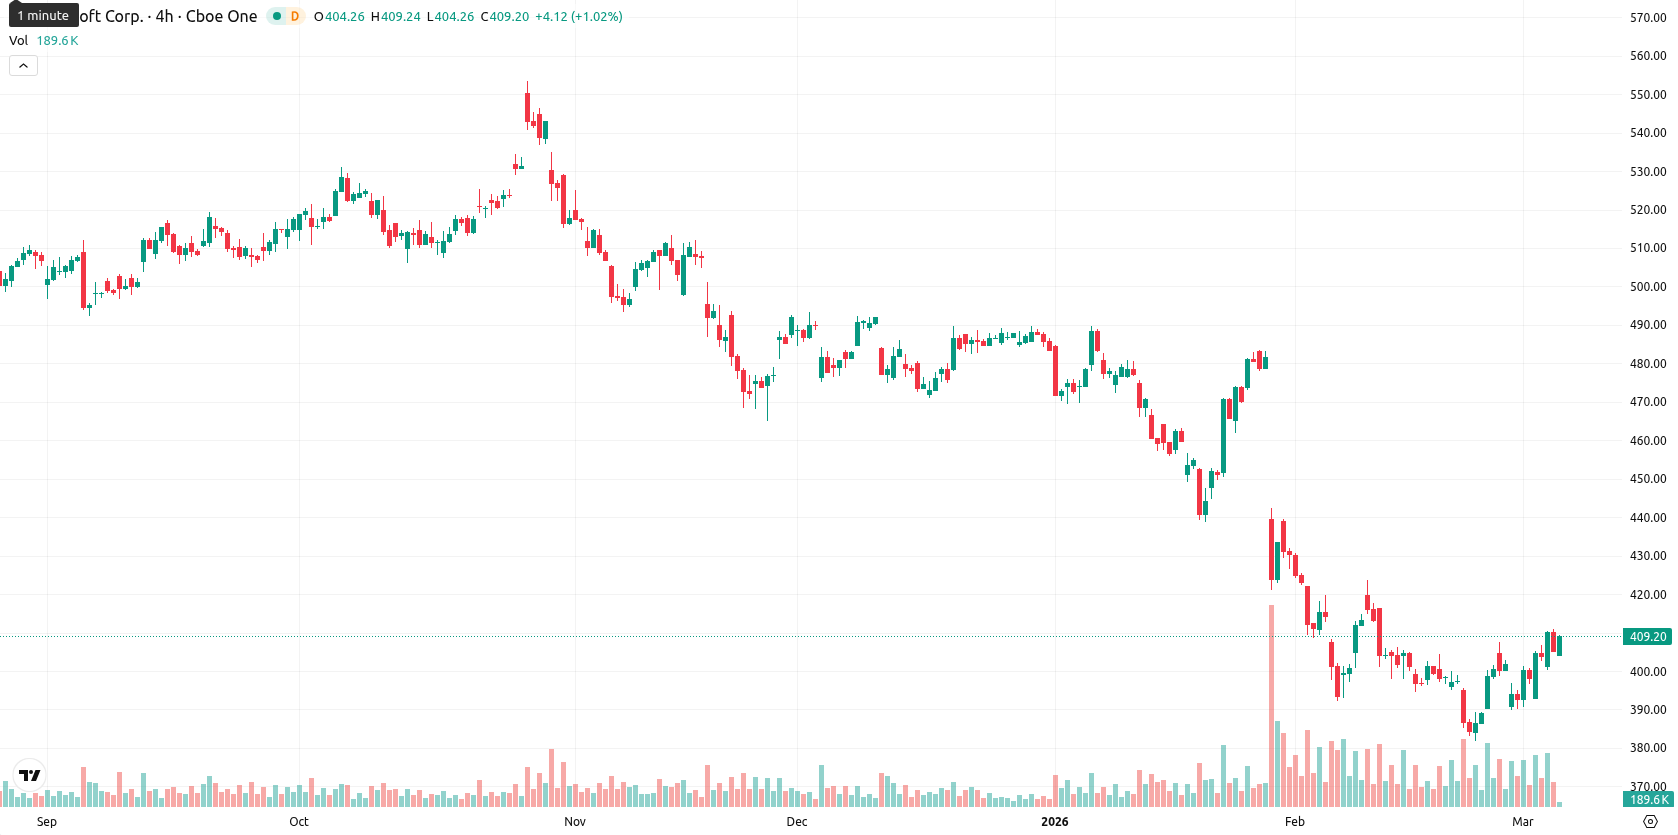
Microsoft Corporation (MSFT) is currently trading at $409.74, posting a weekly gain of $16.79 or 4.13% from its recent low near $392.95. Despite this recovery, the asset remains well below its weekly MA-20 ($462.68) and MA-50 ($469.57), but holds above the MA-200 ($376.47), signaling ongoing medium-term weakness amid long-term structural support.
Highlights
- Microsoft trades below key medium-term moving averages, signaling sustained downward pressure despite support from long-term trends.
- Weekly momentum indicators overwhelmingly indicate dominant seller control, with only oversold oscillators suggesting a limited rebound potential.
- Expected trading range for next week is $389–$430, with a much higher probability of further downside toward major long-term support near $376.
Positive sentiment this week as AI focus and partnerships drive momentum
Microsoft participated in the Morgan Stanley Technology, Media & Telecom Conference 2026, where CEO Satya Nadella discussed the company's ongoing focus on artificial intelligence, investments in data centers, and the partnership with OpenAI. The company reported quarterly operational results of $81.3 billion in revenue and adjusted earnings per share of $4.14 for the quarter ending December 31, 2025. Secondary factors include the robust adoption of the Copilot AI assistant, expansion of partnerships such as with CrowdStrike, and scrutiny from the FTC over its AI initiatives.
Persistent selling this week as technicals show weak momentum below key averages
Weekly technical signals for MSFT remain weak, with price action below the MA-20 and MA-50 but anchored above the MA-200 for broader support. The MACD and ADX on W1 continue to confirm dominant selling pressure, while RSI is subdued and the CCI and Bull/Bear Power reflect oversold conditions. Stochastic RSI shows potential for a short-term rebound, though overall weekly momentum keeps sellers in control. Support is marked at $389.00 and $376.47, while resistance sits near $430.00 and $462.68.
Sideways bias for coming week as upside limited by weak momentum signals
Looking ahead, MSFT is expected to consolidate within a range of $389.00 to $430.00 over the next 5–7 trading days. The likelihood of sustained upside is low, as only 0 out of 4 major weekly momentum indicators signal a buy. The baseline scenario is for sideways movement above $400. In the unlikely event of a bullish breakout above $430, a move to $440 — $450 is possible, while a break below $389 could accelerate a decline toward longer-term support near $376.
Previously it was reported that Microsoft Corporation is trading above its short-term moving average but remains below key medium- and long-term averages, with the Ichimoku Kijun level acting as immediate resistance and institutional investors increasing their positions amid renewed AI investment optimism. Technical signals are mixed with bearish momentum prevailing—MACD and ADX indicate downside risk, while the RSI and oscillators suggest consolidation as near-term support holds but upward movement remains capped.


Latest Microsoft News


-
 Afghanistan
-
 Albania
-
 Algeria
-
 Angola
-
 Argentina
-
 Armenia
-
 Australia
-
 Austria
-
 Azerbaijan
-
 Bahamas
-
 Bahrain
-
 Bangladesh
-
 Belarus
-
 Belgium
-
 Bolivia
-
 Botswana
-
 Brazil
-
 Brunei
-
 Bulgaria
-
 Cambodia
-
 Cameroon
-
 Canada
-
 Chile
Chile
-
 China
China
-
 Colombia
-
 Congo
Congo
-
 Costa Rica
-
 Cote d'Ivoire
-
 Croatia
-
 Cuba
Cuba
-
 Cyprus
-
 Czechia
-
 DR Congo
-
 Denmark
-
 Dominican Republic
-
 Ecuador
-
 Egypt
Egypt
-
 El Salvador
-
 Estonia
-
 Eswatini
-
 Ethiopia
-
 Finland
-
 France
-
 Georgia
-
 Germany
-
 Ghana
Ghana
-
 Greece
-
 Haiti
Haiti
-
 Hong Kong
-
 Hungary
-
 India
India
-
 Indonesia
-
 Iran, Islamic republic
-
 Iraq
Iraq
-
 Ireland
-
 Israel
-
 Italy
Italy
-
 Jamaica
-
 Japan
Japan
-
 Jordan
-
 Kazakhstan
-
 Kenya
Kenya
-
 Korea
Korea
-
 Kuwait
-
 Kyrgyzstan
-
 Laos
Laos
-
 Latvia
-
 Lebanon
-
 Lesotho
-
 Libya
Libya
-
 Lithuania
-
 Luxembourg
-
 Madagascar
-
 Malaysia
-
 Malta
Malta
-
 Mauritius
-
 Mexico
-
 Moldova
-
 Mongolia
-
 Montenegro
-
 Morocco
-
 Mozambique
-
 Myanmar
-
 Namibia
-
 Nepal
Nepal
-
 Netherlands
-
 New Zealand
-
 Nigeria
-
 North Macedonia
-
 Norway
-
 Oman
Oman
-
 Pakistan
-
 Palestine
-
 Panama
-
 Papua New Guinea
-
 Paraguay
-
 Peru
Peru
-
 Philippines
-
 Poland
-
 Portugal
-
 Puerto Rico
-
 Qatar
Qatar
-
 Reunion
-
 Romania
-
 Rwanda
-
 Saudi Arabia
-
 Serbia
-
 Singapore
-
 Slovakia
-
 Slovenia
-
 Somalia
-
 South Africa
-
 Spain
Spain
-
 Sri Lanka
-
 Sweden
-
 Switzerland
-
 Syria
Syria
-
 Taiwan
-
 Tajikistan
-
 Tanzania
-
 Thailand
-
 Trinidad and Tobago
-
 Tunisia
-
 Turkey
-
 UAE
UAE
-
 Uganda
-
 Ukraine
-
 United Kingdom
-
United States
-
 Uruguay
-
 Uzbekistan
-
 Venezuela
-
 Vietnam
-
 Yemen
Yemen
-
 Zambia
-
 Zimbabwe
- Forex
- Crypto
