

Nvidia earnings spark heavy client buying — Interactive Brokers stock slides 3.22%

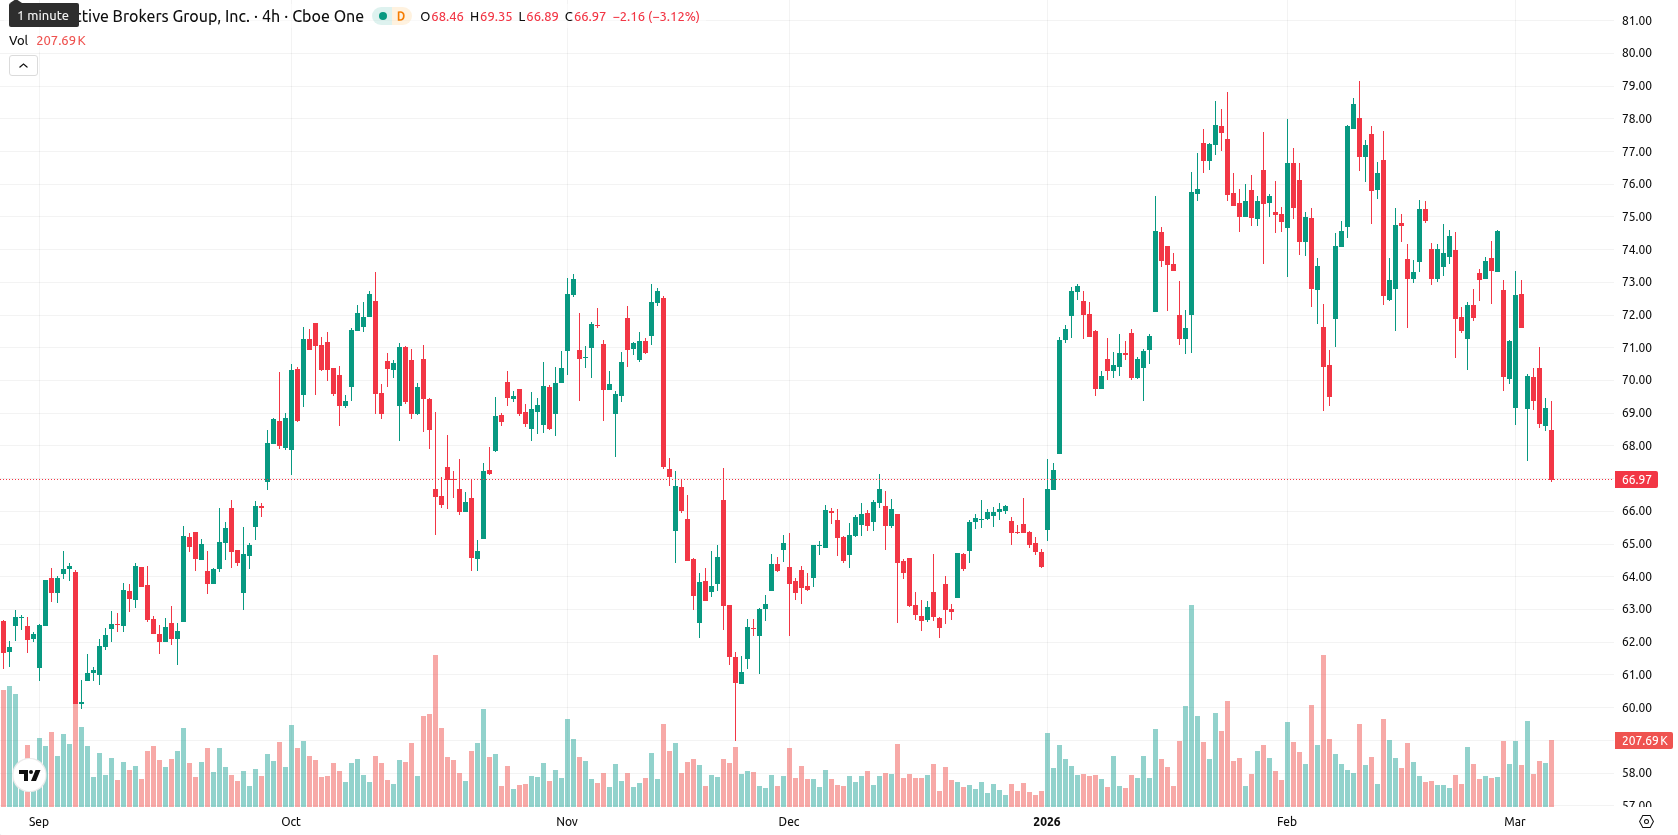
Interactive Brokers Group, Inc. (IBKR) is trading at $66.92, down 3.22% on the day. The price is below the 20-day ($73.35) and 50-day ($72.05) Moving Averages, indicating maintained downward pressure in both the short and medium term; however, it remains above the 200-day Moving Average ($64.77), signaling some longer-term support, with the Ichimoku Kijun at $73.36 acting as immediate resistance.
 86.95
89.05
86.95
89.05
Highlights
- Interactive Brokers clients showed significant net buying of Nvidia after its earnings, reacting to the stock's post-report pullback.
- The surge in Nvidia purchases indicates global retail traders at IBKR sought opportunity in the dip, despite market-wide selling pressure.
- Technically, IBKR trades below major moving averages with negative momentum, but long-term support at $64.77 suggests a likely consolidation between $64.50 and $68.00 in the near term.
Nvidia-driven buying from IBKR clients as global sentiment diverges from shares
Interactive Brokers reported that its customers demonstrated significant buying activity in Nvidia stock following Nvidia's recent earnings release. This behavior was observed through client flows and reflects the response of IBKR's globally diversified trader base to the post-earnings pullback in Nvidia's shares. These data specifically highlight Interactive Brokers’ customer activity and do not indicate any direct change to the company’s operations or regulatory standing, though price action has remained under broader selling pressure.
Oversold pressures persist as technical momentum weakens after volatile close
Momentum signals remain negative for IBKR, with the daily MACD confirming a sell and the ADX pointing to weak trend strength. The Relative Strength Index (RSI) is in sell territory, with both the Stochastic RSI and Commodity Channel Index (CCI) indicating deeply oversold levels, which points to prolonged selling pressure; Bull/Bear Power confirms seller dominance during intraday sessions. There was no significant opening gap, but the price declined sharply after the bell, closing at the lower end of today’s range ($66.90 – $69.31), reflecting heightened intraday volatility. The Awesome Oscillator reinforces the current bearish environment.
Consolidation likely as bullish weekly signals offset recent volatility risk
Over the next five sessions, IBKR is expected to trade within a $64.50 to $68.00 volatility band relative to current levels. Despite recent weakness, three out of four major weekly indicators (RSI, ADX, MACD, and 50-week Moving Average) remain on bullish signals, putting the probability of a price rebound above 80%. The most likely scenario is price consolidation within this corridor; a breakout above immediate resistance at $73.36 could prompt a bullish move, while a decisive loss of support below $64.77 would increase the risk of a more pronounced bearish shift.
Previously it was reported that Interactive Brokers Group is trading below its short- and medium-term moving averages, indicating sustained seller pressure, while remaining above long-term trend support. Momentum indicators, including a neutral MACD and weak ADX, alongside oversold oscillator signals, suggest the stock is likely to consolidate sideways within the $67.00 to $71.00 range as volatility persists and rebound potential remains limited.




Latest Interactive Brokers News





-
 Afghanistan
-
 Albania
-
 Algeria
-
 Angola
-
 Argentina
-
 Armenia
-
 Australia
-
 Austria
-
 Azerbaijan
-
 Bahamas
-
 Bahrain
-
 Bangladesh
-
 Belarus
-
 Belgium
-
 Bolivia
-
 Botswana
-
 Brazil
-
 Brunei
-
 Bulgaria
-
 Cambodia
-
 Cameroon
-
 Canada
-
 Chile
Chile
-
 China
China
-
 Colombia
-
 Congo
Congo
-
 Costa Rica
-
 Cote d'Ivoire
-
 Croatia
-
 Cuba
Cuba
-
 Cyprus
-
 Czechia
-
 DR Congo
-
 Denmark
-
 Dominican Republic
-
 Ecuador
-
 Egypt
Egypt
-
 El Salvador
-
 Estonia
-
 Eswatini
-
 Ethiopia
-
 Finland
-
 France
-
 Georgia
-
 Germany
-
 Ghana
Ghana
-
 Greece
-
 Haiti
Haiti
-
 Hong Kong
-
 Hungary
-
 India
India
-
 Indonesia
-
 Iran, Islamic republic
-
 Iraq
Iraq
-
 Ireland
-
 Israel
-
 Italy
Italy
-
 Jamaica
-
 Japan
Japan
-
 Jordan
-
 Kazakhstan
-
 Kenya
Kenya
-
 Korea
Korea
-
 Kuwait
-
 Kyrgyzstan
-
 Laos
Laos
-
 Latvia
-
 Lebanon
-
 Lesotho
-
 Libya
Libya
-
 Lithuania
-
 Luxembourg
-
 Madagascar
-
 Malaysia
-
 Malta
Malta
-
 Mauritius
-
 Mexico
-
 Moldova
-
 Mongolia
-
 Montenegro
-
 Morocco
-
 Mozambique
-
 Myanmar
-
 Namibia
-
 Nepal
Nepal
-
 Netherlands
-
 New Zealand
-
 Nigeria
-
 North Macedonia
-
 Norway
-
 Oman
Oman
-
 Pakistan
-
 Palestine
-
 Panama
-
 Papua New Guinea
-
 Paraguay
-
 Peru
Peru
-
 Philippines
-
 Poland
-
 Portugal
-
 Puerto Rico
-
 Qatar
Qatar
-
 Reunion
-
 Romania
-
 Rwanda
-
 Saudi Arabia
-
 Serbia
-
 Singapore
-
 Slovakia
-
 Slovenia
-
 Somalia
-
 South Africa
-
 Spain
Spain
-
 Sri Lanka
-
 Sweden
-
 Switzerland
-
 Syria
Syria
-
 Taiwan
-
 Tajikistan
-
 Tanzania
-
 Thailand
-
 Trinidad and Tobago
-
 Tunisia
-
 Turkey
-
 UAE
UAE
-
 Uganda
-
 Ukraine
-
 United Kingdom
-
United States
-
 Uruguay
-
 Uzbekistan
-
 Venezuela
-
 Vietnam
-
 Yemen
Yemen
-
 Zambia
-
 Zimbabwe
- Forex
- Crypto












