
Tesla stock: Bearish tech signals and macro risks trigger sharp slide

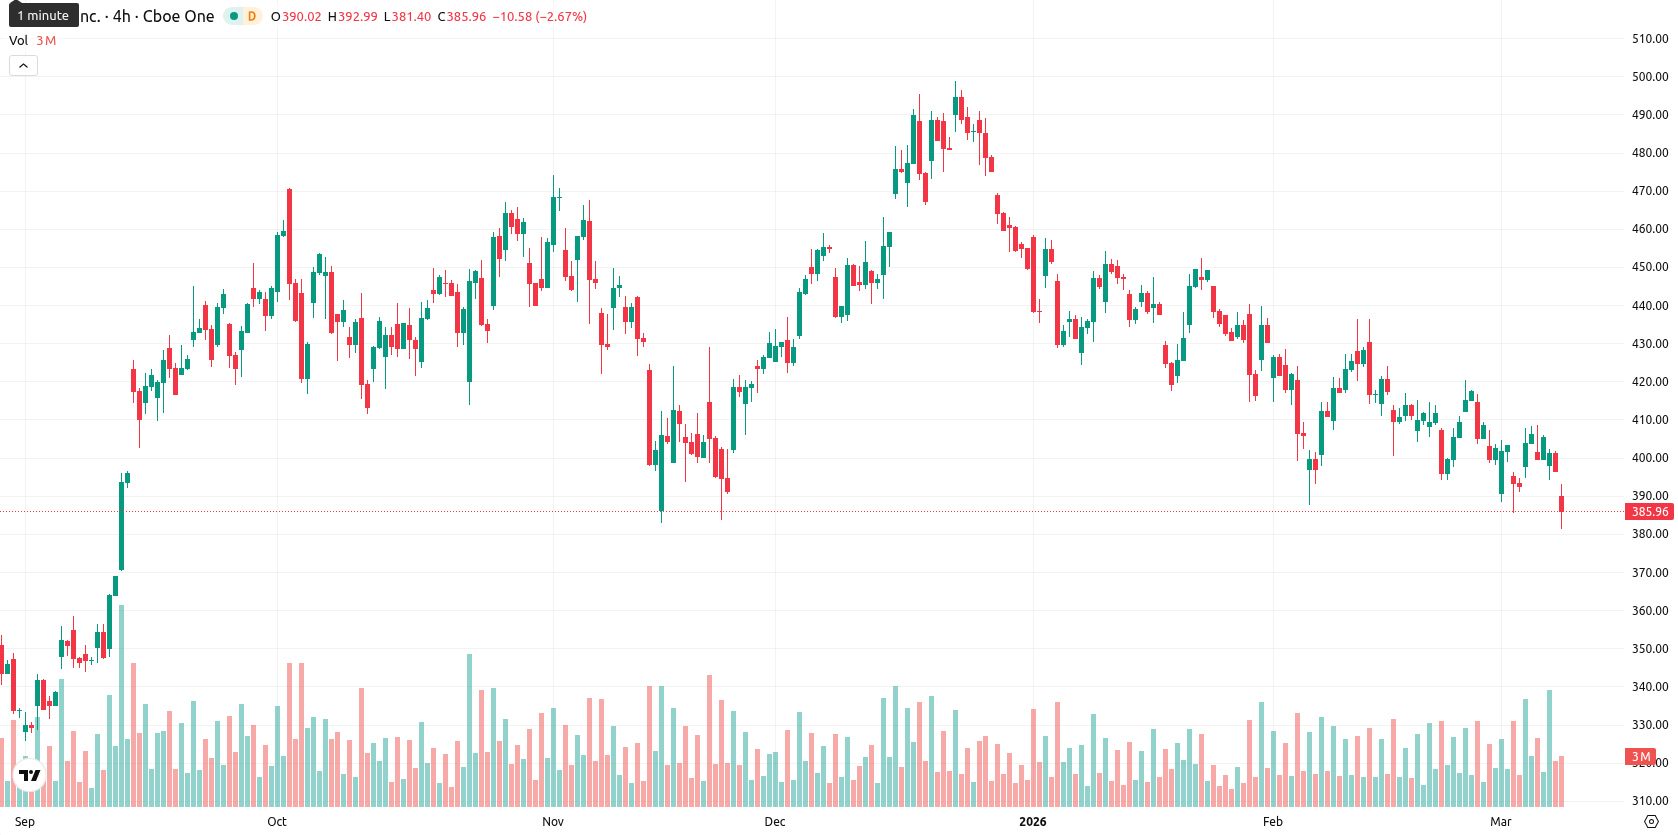
Tesla, Inc. (TSLA) is trading at $387.12, down 2.44% on the day. The price sits below the MA-20 at $410.20, below the MA-50 at $428.02, and just under the MA-200 at $392.09, with $392.09 likely acting as long-term support. Immediate resistance is set at the Ichimoku Kijun level of $412.81.
Highlights
- Investor sentiment has shifted toward Tesla's strategy of AI-driven autonomy and robotics amid heightened volatility and bearish option positioning.
- Recent declines in UK sales and macroeconomic risks in Europe add pressure, though major institutions like BlackRock and State Street maintain sizable holdings.
- Bearish technical momentum dominates, with Tesla shares trading below key averages and likely to fluctuate between $380 and $405 over the next week.
Bearish positioning rises as Tesla faces transition and regulatory uncertainty
Investor focus has shifted to Tesla's ongoing transition from traditional auto sales to AI-driven autonomy and robotics. The company faced increased volatility recently as option traders positioned more bearishly ahead of an upcoming National Highway Traffic Safety Administration deadline. Declining UK sales and expansion of its robotaxi plans were also reported, with European market performance and macroeconomic risks highlighted as further concerns. Several institutional investors, including BlackRock and State Street, maintained substantial stakes, while investment position adjustments by funds such as Korea Investment CORP and Gabelli Funds LLC were recorded, though price action has remained under broader selling pressure.
Bearish momentum intensifies as oversold signals dominate technicals
Momentum indicators for TSLA are bearish, as the MACD shows a sell signal and the ADX at 20.71 reflects weak trend strength. The RSI sits at 41.06, below the neutral level, while both the Commodity Channel Index and Bull/Bear Power suggest oversold conditions and continued seller dominance. The Stochastic RSI is also flashing a sell setup, and this oversold state is observed across most timeframes. The Awesome Oscillator remains neutral, with no meaningful trend support. Today's session saw a slight downward gap at the open, and the current price is near the lower end of the daily range. Volatility has been moderate, and most short-term oscillators confirm the prevailing bearish momentum without notable divergence.
Further declines likely as upside probabilities remain muted
Over the next five trading days, TSLA is expected to trade within the $380 – $405 volatility band relative to current levels. The probability of a sustained upward move is very low (less than 20%), suggesting further declines may be more likely in the near term. The base case scenario sees the price moving sideways between $380 and $405. A breakout above $412.81 would signal a bullish reversal, while a breach of $380 may accelerate downside momentum.
Last time, analysts noted that Tesla shares remained in a consolidation phase below key moving averages, with momentum indicators such as the RSI and MACD signaling a neutral to bearish trend. Key support is identified near $385, with resistance levels at $410 and $420, suggesting further downside risk if support fails or potential for a breakout if resistance is surpassed.


-
 Afghanistan
-
 Albania
-
 Algeria
-
 Angola
-
 Argentina
-
 Armenia
-
 Australia
-
 Austria
-
 Azerbaijan
-
 Bahamas
-
 Bahrain
-
 Bangladesh
-
 Belarus
-
 Belgium
-
 Bolivia
-
 Botswana
-
 Brazil
-
 Brunei
-
 Bulgaria
-
 Cambodia
-
 Cameroon
-
 Canada
-
 Chile
Chile
-
 China
China
-
 Colombia
-
 Congo
Congo
-
 Costa Rica
-
 Cote d'Ivoire
-
 Croatia
-
 Cuba
Cuba
-
 Cyprus
-
 Czechia
-
 DR Congo
-
 Denmark
-
 Dominican Republic
-
 Ecuador
-
 Egypt
Egypt
-
 El Salvador
-
 Estonia
-
 Eswatini
-
 Ethiopia
-
 Finland
-
 France
-
 Georgia
-
 Germany
-
 Ghana
Ghana
-
 Greece
-
 Haiti
Haiti
-
 Hong Kong
-
 Hungary
-
 India
India
-
 Indonesia
-
 Iran, Islamic republic
-
 Iraq
Iraq
-
 Ireland
-
 Israel
-
 Italy
Italy
-
 Jamaica
-
 Japan
Japan
-
 Jordan
-
 Kazakhstan
-
 Kenya
Kenya
-
 Korea
Korea
-
 Kuwait
-
 Kyrgyzstan
-
 Laos
Laos
-
 Latvia
-
 Lebanon
-
 Lesotho
-
 Libya
Libya
-
 Lithuania
-
 Luxembourg
-
 Madagascar
-
 Malaysia
-
 Malta
Malta
-
 Mauritius
-
 Mexico
-
 Moldova
-
 Mongolia
-
 Montenegro
-
 Morocco
-
 Mozambique
-
 Myanmar
-
 Namibia
-
 Nepal
Nepal
-
 Netherlands
-
 New Zealand
-
 Nigeria
-
 North Macedonia
-
 Norway
-
 Oman
Oman
-
 Pakistan
-
 Palestine
-
 Panama
-
 Papua New Guinea
-
 Paraguay
-
 Peru
Peru
-
 Philippines
-
 Poland
-
 Portugal
-
 Puerto Rico
-
 Qatar
Qatar
-
 Reunion
-
 Romania
-
 Rwanda
-
 Saudi Arabia
-
 Serbia
-
 Singapore
-
 Slovakia
-
 Slovenia
-
 Somalia
-
 South Africa
-
 Spain
Spain
-
 Sri Lanka
-
 Sweden
-
 Switzerland
-
 Syria
Syria
-
 Taiwan
-
 Tajikistan
-
 Tanzania
-
 Thailand
-
 Trinidad and Tobago
-
 Tunisia
-
 Turkey
-
 UAE
UAE
-
 Uganda
-
 Ukraine
-
 United Kingdom
-
United States
-
 Uruguay
-
 Uzbekistan
-
 Venezuela
-
 Vietnam
-
 Yemen
Yemen
-
 Zambia
-
 Zimbabwe
- Forex
- Crypto
