
Tesla stock rises 2.69% as Shanghai Gigafactory drives strong global deliveries

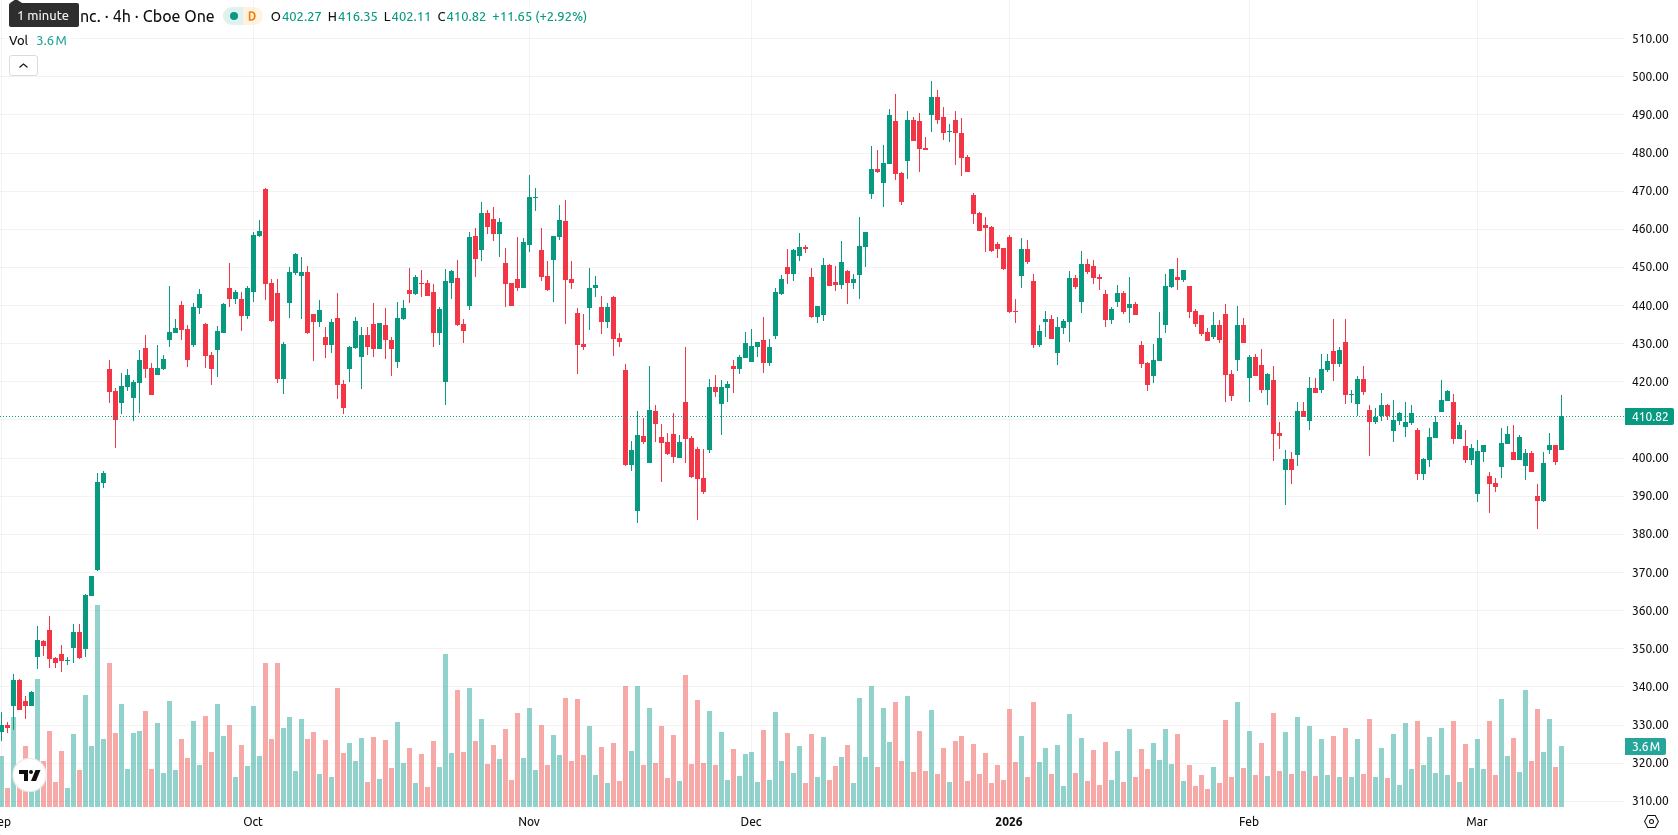
Tesla, Inc. (TSLA) is trading at $409.82 after a daily increase of $10.75, or 2.69%. The stock stands just above its SMA-20 at $408.64, remains below the SMA-50 at $424.56, and trades well above its SMA-200 at $392.68. This setup suggests consolidation in the short term, pressure from sellers in the medium term, and continued support over the long term, with the Ichimoku Kijun at $408.88 serving as immediate resistance.
Highlights
- Tesla's China operations drove growth, with Shanghai Gigafactory deliveries up 91% YoY and comprising 52% of global 2025 output.
- Expansion of Supercharger infrastructure and new launches, including Model Y L in South Korea, boosted international reach and recurring revenues.
- Technicals signal consolidation; traders expect price between $406.50–$418.50 as momentum indicators show moderation with a bearish tilt.
China deliveries and tech launches drive global expansion
Tesla's recent rise is fueled by robust growth in its China operations, as Shanghai Gigafactory vehicle deliveries surged by 91% year-over-year in February 2026, contributing to 851,000 vehicles for 2025, or about 52% of global deliveries. The company is expanding its charging network, surpassing 2,500 Supercharger stations in China and achieving a 19% increase in paid Supercharging revenues. Additionally, Tesla launched the six-seater Model Y L in South Korea and reported strong adoption of its Full Self-Driving technology, while also becoming the top-selling auto brand in Norway for February 2026.
Mixed momentum persists as buyers test upper volatility band
Momentum signals are mixed for TSLA. Both daily MACD and ADX point to weak or negative momentum, while the RSI at 42.50, along with CCI and Stoch RSI, cluster near neutral or soft-sell levels, showing no extreme overbought or oversold signal. BBP’s intraday overbought reading and positive value highlight buyer dominance, and the Awesome Oscillator is neutral. TSLA opened with a mild upward gap from $399.08 to $404.03 and continued climbing to the upper portion of today’s $403.83 – $415.69 volatility band, reflecting sustained buyer strength. Key support is at $408, resistance at the Kijun ($408.88), and continued strength above SMA-200 underpins long-term support.
Sideways range likely amid low conviction breakout signals
In the short term, TSLA is expected to trade within a $406.50 – $418.50 volatility band relative to current levels over the next five trading days, reflecting moderate price swings. Only one in four weekly technical signals suggests a buy, indicating a low probability (less than 20%) of a sustained upward breakout. The baseline scenario calls for oscillation between $406.50 and $418.50 as momentum normalizes, while a bullish move above $408.88 could target the weekly high. A bearish outcome may unfold if support at $408 fails, with prices drifting back toward $406.50 or lower.
Previously it was reported that Tesla Inc. is exhibiting short-term positive momentum as current price action sits above its 20-day moving average but remains below the 50-day, indicating strength within a broader downtrend. Technical indicators, including a "Strong Sell" MACD, weak ADX, subdued RSI and CCI, and high intraday volatility, reflect rising uncertainty and mixed momentum, with buyers maintaining control near key resistance despite ongoing rangebound trading.


-
 Afghanistan
-
 Albania
-
 Algeria
-
 Angola
-
 Argentina
-
 Armenia
-
 Australia
-
 Austria
-
 Azerbaijan
-
 Bahamas
-
 Bahrain
-
 Bangladesh
-
 Belarus
-
 Belgium
-
 Bolivia
-
 Botswana
-
 Brazil
-
 Brunei
-
 Bulgaria
-
 Cambodia
-
 Cameroon
-
 Canada
-
 Chile
Chile
-
 China
China
-
 Colombia
-
 Congo
Congo
-
 Costa Rica
-
 Cote d'Ivoire
-
 Croatia
-
 Cuba
Cuba
-
 Cyprus
-
 Czechia
-
 DR Congo
-
 Denmark
-
 Dominican Republic
-
 Ecuador
-
 Egypt
Egypt
-
 El Salvador
-
 Estonia
-
 Eswatini
-
 Ethiopia
-
 Finland
-
 France
-
 Georgia
-
 Germany
-
 Ghana
Ghana
-
 Greece
-
 Haiti
Haiti
-
 Hong Kong
-
 Hungary
-
 India
India
-
 Indonesia
-
 Iran, Islamic republic
-
 Iraq
Iraq
-
 Ireland
-
 Israel
-
 Italy
Italy
-
 Jamaica
-
 Japan
Japan
-
 Jordan
-
 Kazakhstan
-
 Kenya
Kenya
-
 Korea
Korea
-
 Kuwait
-
 Kyrgyzstan
-
 Laos
Laos
-
 Latvia
-
 Lebanon
-
 Lesotho
-
 Libya
Libya
-
 Lithuania
-
 Luxembourg
-
 Madagascar
-
 Malaysia
-
 Malta
Malta
-
 Mauritius
-
 Mexico
-
 Moldova
-
 Mongolia
-
 Montenegro
-
 Morocco
-
 Mozambique
-
 Myanmar
-
 Namibia
-
 Nepal
Nepal
-
 Netherlands
-
 New Zealand
-
 Nigeria
-
 North Macedonia
-
 Norway
-
 Oman
Oman
-
 Pakistan
-
 Palestine
-
 Panama
-
 Papua New Guinea
-
 Paraguay
-
 Peru
Peru
-
 Philippines
-
 Poland
-
 Portugal
-
 Puerto Rico
-
 Qatar
Qatar
-
 Reunion
-
 Romania
-
 Rwanda
-
 Saudi Arabia
-
 Serbia
-
 Singapore
-
 Slovakia
-
 Slovenia
-
 Somalia
-
 South Africa
-
 Spain
Spain
-
 Sri Lanka
-
 Sweden
-
 Switzerland
-
 Syria
Syria
-
 Taiwan
-
 Tajikistan
-
 Tanzania
-
 Thailand
-
 Trinidad and Tobago
-
 Tunisia
-
 Turkey
-
 UAE
UAE
-
 Uganda
-
 Ukraine
-
 United Kingdom
-
United States
-
 Uruguay
-
 Uzbekistan
-
 Venezuela
-
 Vietnam
-
 Yemen
Yemen
-
 Zambia
-
 Zimbabwe
- Forex
- Crypto
