
+1.27% for Tesla stock — Geopolitical risk in China trade

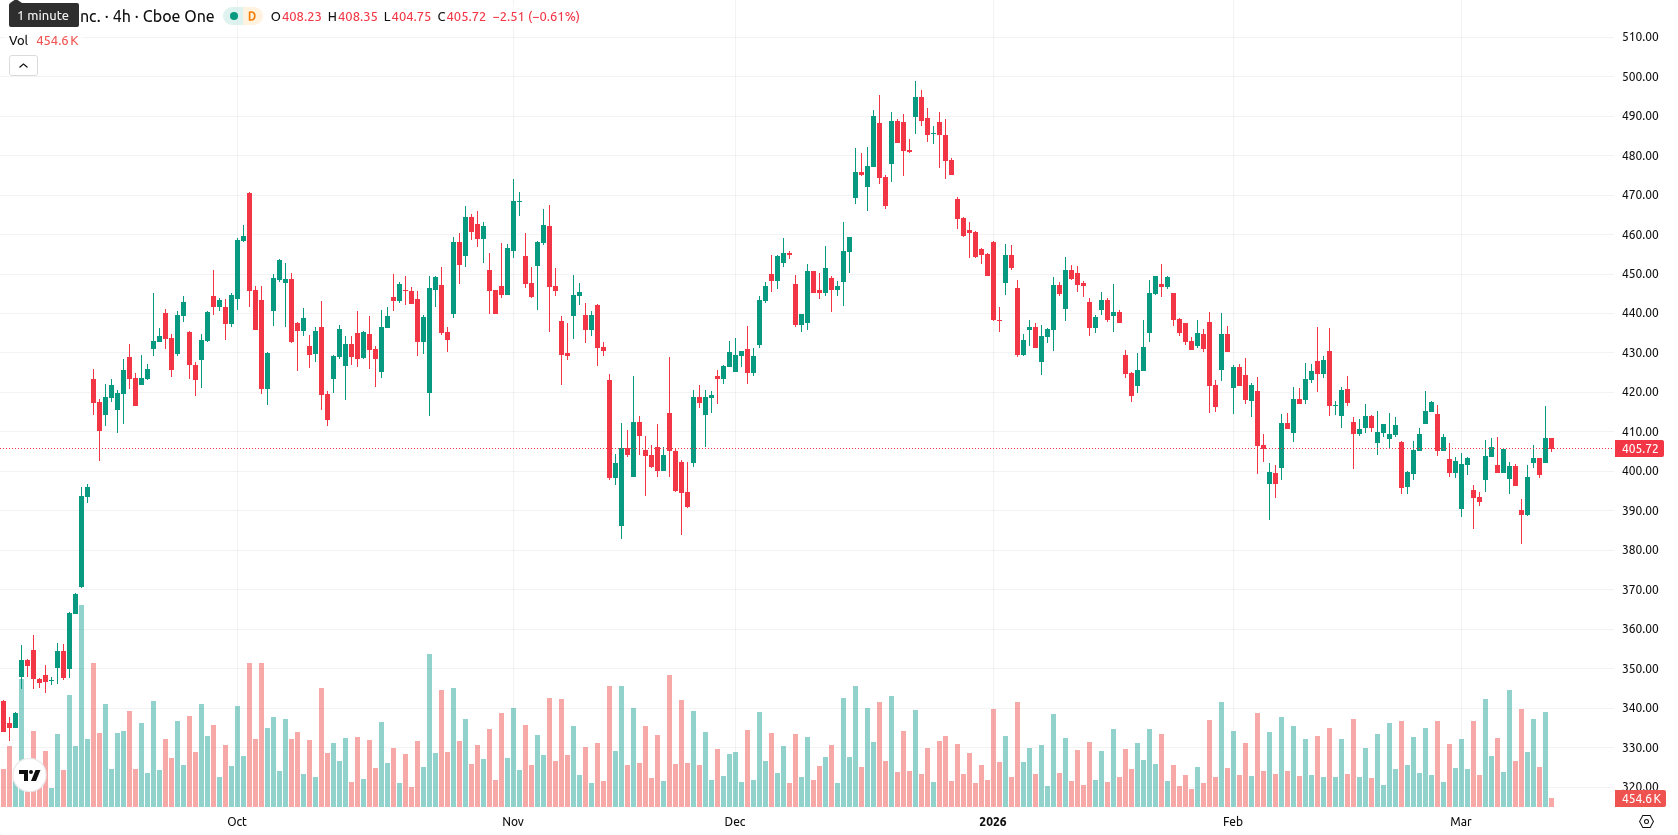
Tesla, Inc. (TSLA) is trading at $404.13 after climbing 1.27% intraday. The stock remains below both the SMA-20 ($408.64) and SMA-50 ($424.56) but persists above the SMA-200 ($392.68), indicating nearby resistance and longer-term support. The Ichimoku Kijun at $408.88 marks immediate resistance just above the current level.
Highlights
- Tesla faces higher geopolitical and operational risk as 30% of its revenue depends on China amid intensifying U.S.-China tensions and protectionist policies.
- Imminent changes to U.S. EV tax credits and rising competition from domestic Chinese manufacturers threaten Tesla’s supply chain efficiency and global market share.
- TSLA trades below key moving averages and is likely to remain range-bound between $395 and $420, with bearish momentum prevailing and limited prospects for a near-term breakout.
Risk profile rises as policy shifts and China exposure grow
On Wednesday, March 11, 2026, government policy changes and intensifying geopolitical tensions have elevated the risk profile for Tesla. Roughly 30% of Tesla's sales rely on China, exposing the company to ongoing geopolitical frictions and protectionist measures that could limit market access or mandate preferential treatment for domestic competitors. The 2025 expiration of certain U.S. federal EV tax credits, replaced by requirements for localized battery production, has forced Tesla to adapt its supply chain, resulting in increased regulatory and operational risks. Escalating competition with Chinese automakers such as BYD and vulnerability to potential trade restrictions or retaliatory tariffs further impact Tesla’s global sales outlook. Additionally, persistent volatility in global energy costs and electricity supply policy in the U.S. and other major markets threaten the cost structure and affordability of Tesla’s products.
Mixed momentum clouds outlook amid resistance and consolidation
Technical signals for TSLA are mixed. The stock is pinned between intermediate resistance from the SMA-20 and SMA-50 and longer-term support at the SMA-200. The Ichimoku Kijun at $408.88 highlights overhead resistance, while the current range is defined by recent tests of $403.83–$415.69. Momentum indicators are conflicted: the D1 MACD gives a strong sell, ADX at 21.43 points to weak trend strength, and RSI (42.5) with CCI (-55.79) reflect a neutral stance. Stoch RSI is neutral to slightly positive, and BBP at 2.52 signals buyers dominating intraday, despite overall direction remaining unclear. Volatility is moderate and price action is consolidating after an early session climb.
Sideways trading likely as breakout odds remain subdued
Over the next five sessions, TSLA is expected to fluctuate within the $395–$420 volatility band relative to current levels. The technical indicator set shows less than a 20% probability of upward breakout, with sideways movement within this range being the baseline scenario. A close above $409 and a sustained move over $420 would open the door for a bullish extension, while a drop below $395 could accelerate downside toward the SMA-200.
Previously it was reported that Tesla, Inc. is consolidating just above its short-term moving average but remains under medium-term resistance, with technical indicators including MACD, ADX, and RSI reflecting mixed to weak momentum in a rangebound setup. Buyers are testing immediate resistance around the Ichimoku Kijun, with key support near $408, while overall signals suggest limited conviction for a sustained breakout as the stock oscillates within a defined volatility band.


-
 Afghanistan
-
 Albania
-
 Algeria
-
 Angola
-
 Argentina
-
 Armenia
-
 Australia
-
 Austria
-
 Azerbaijan
-
 Bahamas
-
 Bahrain
-
 Bangladesh
-
 Belarus
-
 Belgium
-
 Bolivia
-
 Botswana
-
 Brazil
-
 Brunei
-
 Bulgaria
-
 Cambodia
-
 Cameroon
-
 Canada
-
 Chile
Chile
-
 China
China
-
 Colombia
-
 Congo
Congo
-
 Costa Rica
-
 Cote d'Ivoire
-
 Croatia
-
 Cuba
Cuba
-
 Cyprus
-
 Czechia
-
 DR Congo
-
 Denmark
-
 Dominican Republic
-
 Ecuador
-
 Egypt
Egypt
-
 El Salvador
-
 Estonia
-
 Eswatini
-
 Ethiopia
-
 Finland
-
 France
-
 Georgia
-
 Germany
-
 Ghana
Ghana
-
 Greece
-
 Haiti
Haiti
-
 Hong Kong
-
 Hungary
-
 India
India
-
 Indonesia
-
 Iran, Islamic republic
-
 Iraq
Iraq
-
 Ireland
-
 Israel
-
 Italy
Italy
-
 Jamaica
-
 Japan
Japan
-
 Jordan
-
 Kazakhstan
-
 Kenya
Kenya
-
 Korea
Korea
-
 Kuwait
-
 Kyrgyzstan
-
 Laos
Laos
-
 Latvia
-
 Lebanon
-
 Lesotho
-
 Libya
Libya
-
 Lithuania
-
 Luxembourg
-
 Madagascar
-
 Malaysia
-
 Malta
Malta
-
 Mauritius
-
 Mexico
-
 Moldova
-
 Mongolia
-
 Montenegro
-
 Morocco
-
 Mozambique
-
 Myanmar
-
 Namibia
-
 Nepal
Nepal
-
 Netherlands
-
 New Zealand
-
 Nigeria
-
 North Macedonia
-
 Norway
-
 Oman
Oman
-
 Pakistan
-
 Palestine
-
 Panama
-
 Papua New Guinea
-
 Paraguay
-
 Peru
Peru
-
 Philippines
-
 Poland
-
 Portugal
-
 Puerto Rico
-
 Qatar
Qatar
-
 Reunion
-
 Romania
-
 Rwanda
-
 Saudi Arabia
-
 Serbia
-
 Singapore
-
 Slovakia
-
 Slovenia
-
 Somalia
-
 South Africa
-
 Spain
Spain
-
 Sri Lanka
-
 Sweden
-
 Switzerland
-
 Syria
Syria
-
 Taiwan
-
 Tajikistan
-
 Tanzania
-
 Thailand
-
 Trinidad and Tobago
-
 Tunisia
-
 Turkey
-
 UAE
UAE
-
 Uganda
-
 Ukraine
-
 United Kingdom
-
United States
-
 Uruguay
-
 Uzbekistan
-
 Venezuela
-
 Vietnam
-
 Yemen
Yemen
-
 Zambia
-
 Zimbabwe
- Forex
- Crypto
