
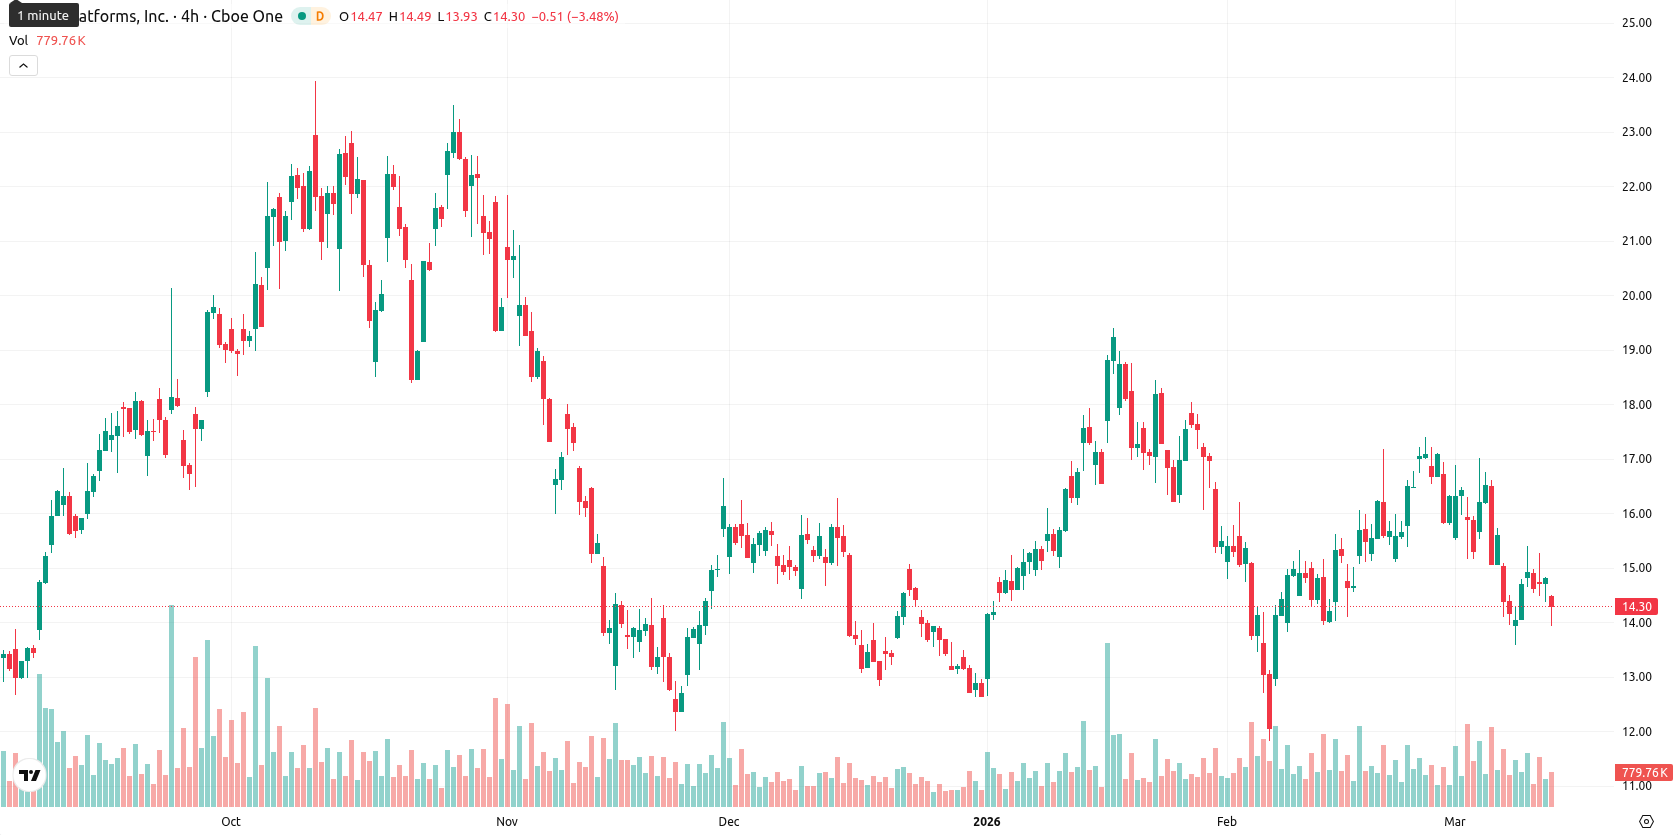
Riot Platforms stock: Weak momentum and seller dominance drive further downside

Riot Platforms (RIOT) is trading at $14.29, which is below the SMA-20 ($15.55) and SMA-50 ($15.60), indicating ongoing short- and medium-term pressure from sellers, as well as below the SMA-200 ($14.82), signaling longer-term resistance overhead. The Ichimoku Kijun level stands at $14.61, just above the current price, making it an immediate resistance.
Highlights
- RIOT remains under sustained seller pressure, trading below major moving averages and facing key overhead resistance.
- Momentum and breadth indicators point to continued bearish sentiment and weak trend strength, with multiple signals in oversold territory.
- The expected price range over the next week is $14.03 to $16.63, with a further decline more likely unless $14.61 is reclaimed.
Bearish momentum persists as indicators signal oversold stretch
Momentum signals remain weak, with the MACD displaying negative momentum and the ADX showing low trend strength. RSI and CCI are both in sell territory, while the Stoch RSI and BBP indicate oversold conditions and strong pressure from sellers. The Awesome Oscillator also aligns with the prevailing negative trend. RIOT opened slightly below its previous close, reflecting a small gap down, and currently trades near the lower end of today’s range ($13.94 – $14.46) after slipping 3.49%. Intraday volatility is moderate, with persistent pressure after the open as momentum indicators and price action both signal bearish sentiment, though oversold indicators suggest downside momentum could be overstretched in the near term.
Further downside favored as upside odds diminish amid consolidation
For the next five trading days, the expected price range is $14.03 to $16.63. The probability of a price increase is very low (less than 20%), making further declines more likely. The baseline scenario sees RIOT consolidating in a sideways corridor between support and immediate resistance. A bullish scenario would require rapidly reclaiming and holding above $14.61 (Kijun), opening the door to a move toward $16.63, while in a bearish case, a break below $14.03 could trigger additional downside as medium-term pressures persist.
Previously it was reported that Riot Platforms Inc. is trading below its short-, medium-, and long-term moving averages, with the price under persistent selling pressure and sellers dominating across key technical indicators. Momentum remains weak as oscillators, including MACD, ADX, RSI, CCI, and BBP, confirm a bearish tone with little sign of reversal and the stock consolidating near intraday lows.


-
 Afghanistan
-
 Albania
-
 Algeria
-
 Angola
-
 Argentina
-
 Armenia
-
 Australia
-
 Austria
-
 Azerbaijan
-
 Bahamas
-
 Bahrain
-
 Bangladesh
-
 Belarus
-
 Belgium
-
 Bolivia
-
 Botswana
-
 Brazil
-
 Brunei
-
 Bulgaria
-
 Cambodia
-
 Cameroon
-
 Canada
-
 Chile
Chile
-
 China
China
-
 Colombia
-
 Congo
Congo
-
 Costa Rica
-
 Cote d'Ivoire
-
 Croatia
-
 Cuba
Cuba
-
 Cyprus
-
 Czechia
-
 DR Congo
-
 Denmark
-
 Dominican Republic
-
 Ecuador
-
 Egypt
Egypt
-
 El Salvador
-
 Estonia
-
 Eswatini
-
 Ethiopia
-
 Finland
-
 France
-
 Georgia
-
 Germany
-
 Ghana
Ghana
-
 Greece
-
 Haiti
Haiti
-
 Hong Kong
-
 Hungary
-
 India
India
-
 Indonesia
-
 Iran, Islamic republic
-
 Iraq
Iraq
-
 Ireland
-
 Israel
-
 Italy
Italy
-
 Jamaica
-
 Japan
Japan
-
 Jordan
-
 Kazakhstan
-
 Kenya
Kenya
-
 Korea
Korea
-
 Kuwait
-
 Kyrgyzstan
-
 Laos
Laos
-
 Latvia
-
 Lebanon
-
 Lesotho
-
 Libya
Libya
-
 Lithuania
-
 Luxembourg
-
 Madagascar
-
 Malaysia
-
 Malta
Malta
-
 Mauritius
-
 Mexico
-
 Moldova
-
 Mongolia
-
 Montenegro
-
 Morocco
-
 Mozambique
-
 Myanmar
-
 Namibia
-
 Nepal
Nepal
-
 Netherlands
-
 New Zealand
-
 Nigeria
-
 North Macedonia
-
 Norway
-
 Oman
Oman
-
 Pakistan
-
 Palestine
-
 Panama
-
 Papua New Guinea
-
 Paraguay
-
 Peru
Peru
-
 Philippines
-
 Poland
-
 Portugal
-
 Puerto Rico
-
 Qatar
Qatar
-
 Reunion
-
 Romania
-
 Rwanda
-
 Saudi Arabia
-
 Serbia
-
 Singapore
-
 Slovakia
-
 Slovenia
-
 Somalia
-
 South Africa
-
 Spain
Spain
-
 Sri Lanka
-
 Sweden
-
 Switzerland
-
 Syria
Syria
-
 Taiwan
-
 Tajikistan
-
 Tanzania
-
 Thailand
-
 Trinidad and Tobago
-
 Tunisia
-
 Turkey
-
 UAE
UAE
-
 Uganda
-
 Ukraine
-
 United Kingdom
-
United States
-
 Uruguay
-
 Uzbekistan
-
 Venezuela
-
 Vietnam
-
 Yemen
Yemen
-
 Zambia
-
 Zimbabwe
- Forex
- Crypto
