
Bearish indicators persist across timeframes — Bit Digital stock gains 3.10%

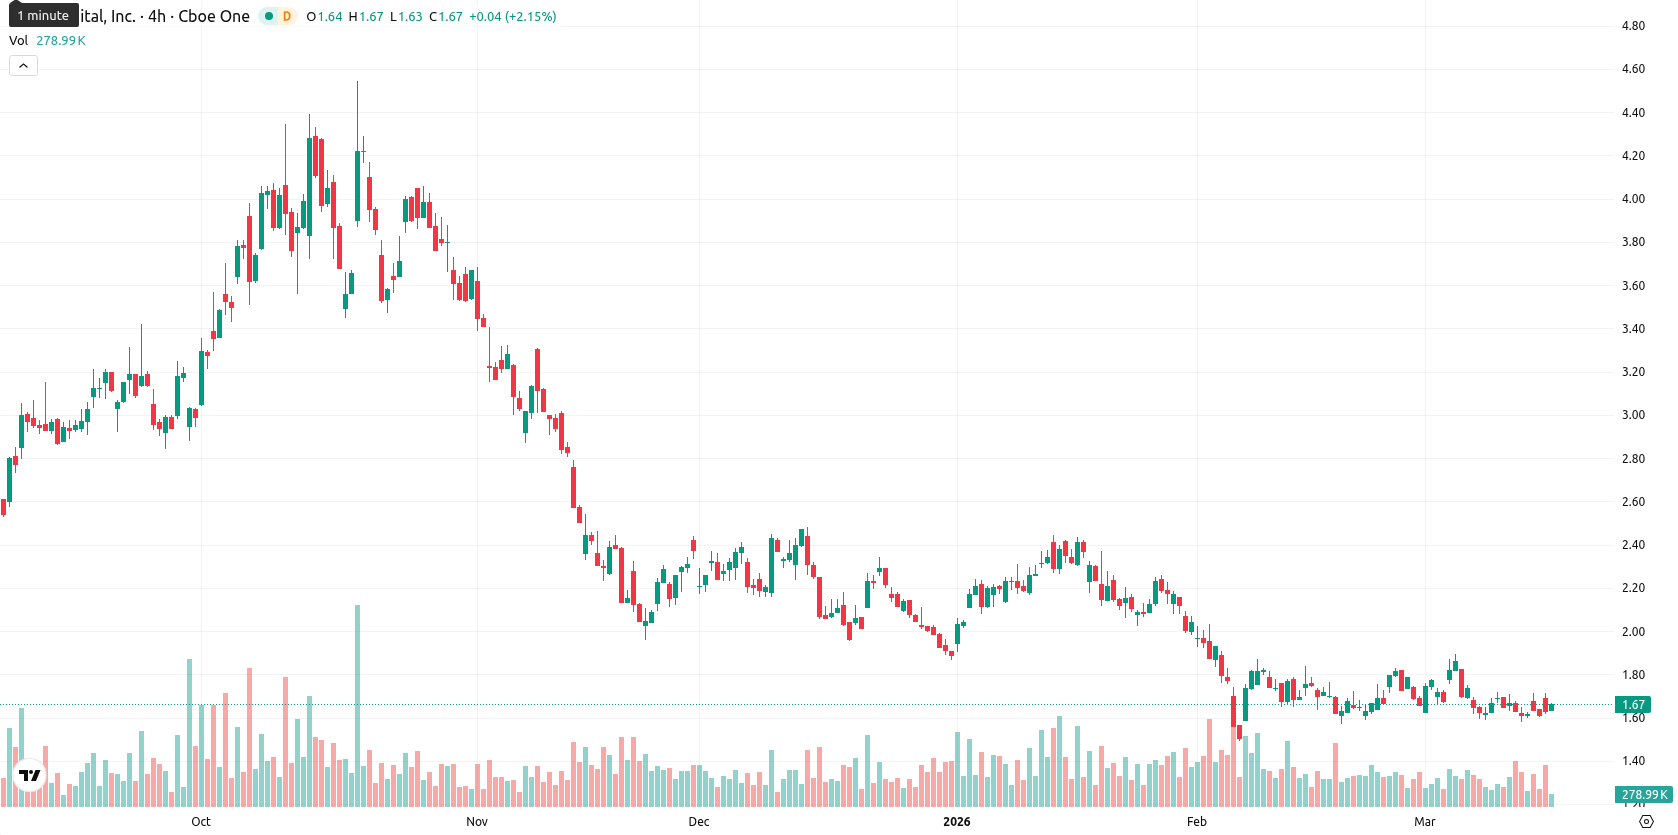
Bit Digital Inc (BTBT) is trading at $1.67 after gaining 3.10% today. The price remains below the MA-20 at $1.69, MA-50 at $1.91, and MA-200 at $2.64, signaling ongoing pressure from sellers across all major timeframes.
Highlights
- BTBT trades below key moving averages, indicating sustained bearish momentum across all timeframes amid persistent selling pressure.
- Technical indicators reflect weak momentum, oversold conditions, and an absence of clear trend strength, limiting prospects for immediate recovery.
- Next five days see expected price action within $1.55–$1.80, with a breakdown below $1.61 risking downside acceleration toward $1.55.
Momentum weakens as oversold readings face nearby resistance
Momentum remains weak, with both daily and weekly MACD on strong sell signals, while ADX readings are neutral and low, showing a lack of clear trend strength. RSI stands at 42 on the daily chart and 36 on the weekly, accompanied by a CCI below –70 and a Stoch RSI in oversold territory, highlighting oversold conditions without a confirmed reversal. The price sits just below the Ichimoku Kijun level at $1.69, which serves as immediate resistance, and session trading is within a moderate band between $1.61 and $1.71, reflecting slight resilience after a positive open but continued underlying bearishness.
Bearish risks build as breakout triggers hover near volatility floor
For the next five trading days, the expected price range is $1.55 to $1.80, reflecting the typical volatility band relative to current levels. All major weekly indicators — including MA-50, MACD, RSI, and ADX — remain bearish or neutral, making the likelihood of a sustained move higher below 20%, and a further decline more probable. Baseline expectations favor sideways movement within this range, with a bullish scenario possible if $1.69 is broken, targeting $1.80. A break below $1.61 may open the path to $1.55.
Earlier, analysts noted that Bit Digital continued to face persistent bearish momentum beneath key moving averages amid mixed technical signals. The latest price action and momentum indicators reinforce this cautious stance, suggesting that traders should watch for a decisive move above $1.69 or below $1.61 to signal the next directional shift.


Latest Bit Digital News


-
 Afghanistan
-
 Albania
-
 Algeria
-
 Angola
-
 Argentina
-
 Armenia
-
 Australia
-
 Austria
-
 Azerbaijan
-
 Bahamas
-
 Bahrain
-
 Bangladesh
-
 Belarus
-
 Belgium
-
 Bolivia
-
 Botswana
-
 Brazil
-
 Brunei
-
 Bulgaria
-
 Cambodia
-
 Cameroon
-
 Canada
-
 Chile
Chile
-
 China
China
-
 Colombia
-
 Congo
Congo
-
 Costa Rica
-
 Cote d'Ivoire
-
 Croatia
-
 Cuba
Cuba
-
 Cyprus
-
 Czechia
-
 DR Congo
-
 Denmark
-
 Dominican Republic
-
 Ecuador
-
 Egypt
Egypt
-
 El Salvador
-
 Estonia
-
 Eswatini
-
 Ethiopia
-
 Finland
-
 France
-
 Georgia
-
 Germany
-
 Ghana
Ghana
-
 Greece
-
 Haiti
Haiti
-
 Hong Kong
-
 Hungary
-
 India
India
-
 Indonesia
-
 Iran, Islamic republic
-
 Iraq
Iraq
-
 Ireland
-
 Israel
-
 Italy
Italy
-
 Jamaica
-
 Japan
Japan
-
 Jordan
-
 Kazakhstan
-
 Kenya
Kenya
-
 Korea
Korea
-
 Kuwait
-
 Kyrgyzstan
-
 Laos
Laos
-
 Latvia
-
 Lebanon
-
 Lesotho
-
 Libya
Libya
-
 Lithuania
-
 Luxembourg
-
 Madagascar
-
 Malaysia
-
 Malta
Malta
-
 Mauritius
-
 Mexico
-
 Moldova
-
 Mongolia
-
 Montenegro
-
 Morocco
-
 Mozambique
-
 Myanmar
-
 Namibia
-
 Nepal
Nepal
-
 Netherlands
-
 New Zealand
-
 Nigeria
-
 North Macedonia
-
 Norway
-
 Oman
Oman
-
 Pakistan
-
 Palestine
-
 Panama
-
 Papua New Guinea
-
 Paraguay
-
 Peru
Peru
-
 Philippines
-
 Poland
-
 Portugal
-
 Puerto Rico
-
 Qatar
Qatar
-
 Reunion
-
 Romania
-
 Rwanda
-
 Saudi Arabia
-
 Serbia
-
 Singapore
-
 Slovakia
-
 Slovenia
-
 Somalia
-
 South Africa
-
 Spain
Spain
-
 Sri Lanka
-
 Sweden
-
 Switzerland
-
 Syria
Syria
-
 Taiwan
-
 Tajikistan
-
 Tanzania
-
 Thailand
-
 Trinidad and Tobago
-
 Tunisia
-
 Turkey
-
 UAE
UAE
-
 Uganda
-
 Ukraine
-
 United Kingdom
-
United States
-
 Uruguay
-
 Uzbekistan
-
 Venezuela
-
 Vietnam
-
 Yemen
Yemen
-
 Zambia
-
 Zimbabwe
- Forex
- Crypto
