
-3.06% for Intuit stock as technicals remain bearish following earnings surge

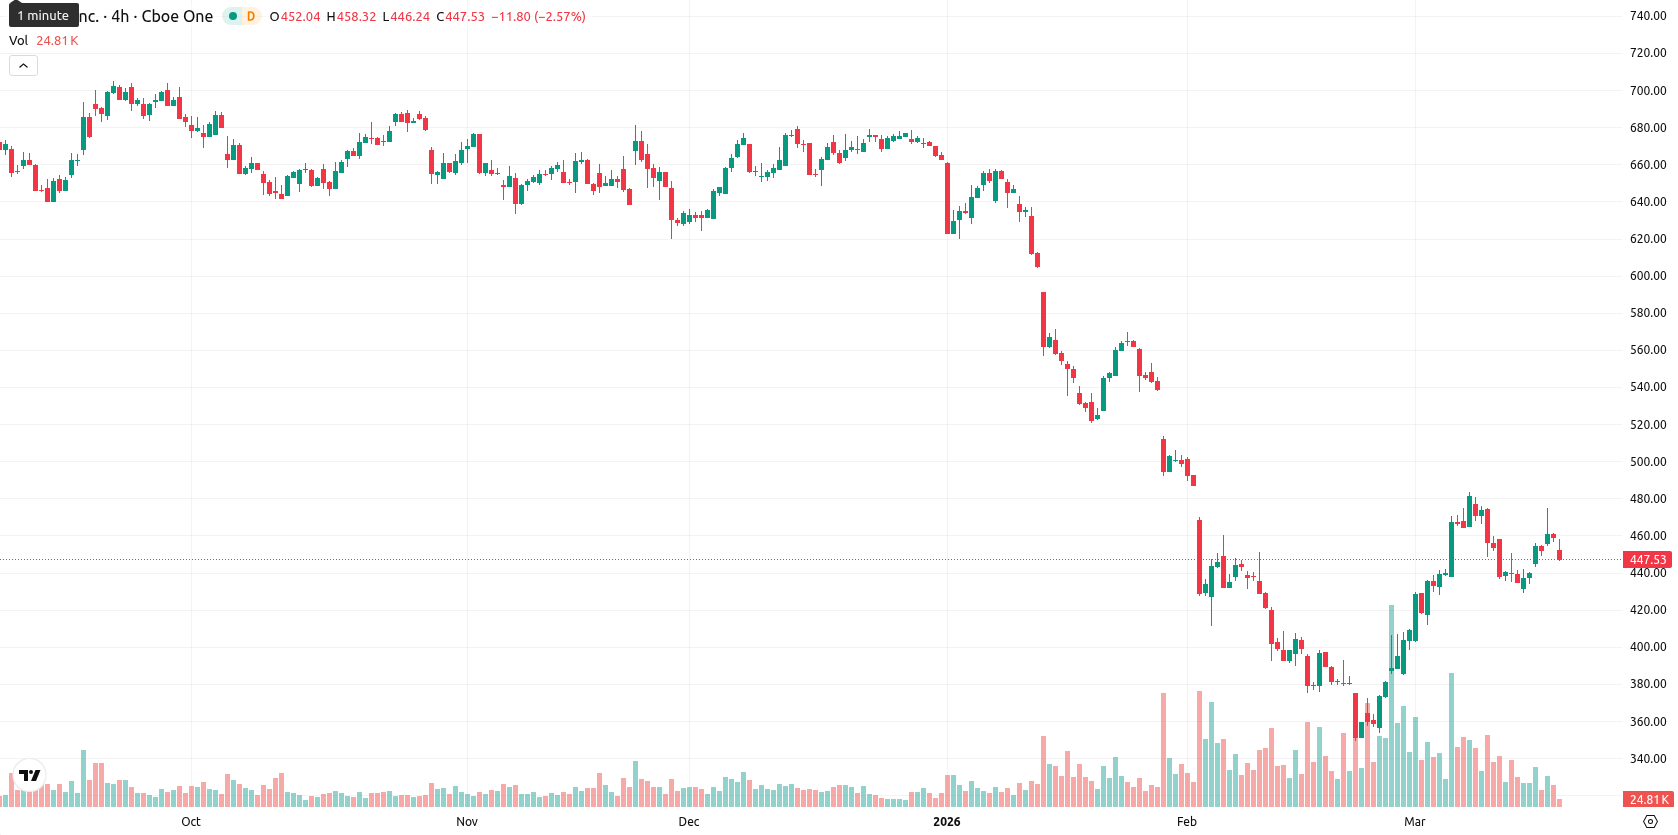
Intuit Inc. (INTU) is trading at $445.42 after declining 3.06% on the day. The stock trades above its SMA-20 of $422.48, but remains below the SMA-50 at $481.64 and the SMA-200 at $646.01, reflecting short-term relative strength but persistent selling pressure in medium and long-term trends.
Highlights
- Intuit accelerated its buyback program, planning to deploy up to $3.5 billion by January 2026 after repurchasing $1.8 billion in shares—up 40% year over year.
- Q2 results exceeded consensus, with 17.4% revenue growth and non-GAAP EPS up 25%, prompting the board to declare a $1.20 dividend and reiterate guidance.
- Despite strong fundamentals, shares remain under sustained selling pressure with a projected $430–$455 trading range and bearish technical signals indicating low probability of near-term upside.
Buybacks and earnings exceed forecasts as insiders halt sales
Intuit has accelerated its share repurchase program, with plans to utilize up to $3.5 billion remaining under its board authorization by the end of January 2026. The company repurchased $1.8 billion in shares during the first half of its fiscal year, a 40% increase compared to the prior year, and founder and senior executives have ended prescheduled stock-sale plans. Intuit reported 17.4% year-over-year revenue growth and 25% non-GAAP diluted EPS growth in the second quarter, both exceeding analyst consensus, and maintained its full-year and Q3 2026 EPS guidance. A quarterly dividend of $1.20 per share was declared, with leadership affirming the business's insulation from AI-driven disruption due to its unique data, expertise, and AI integration, though price action has remained under broader selling pressure.
Mixed momentum as support holds despite persistent bearish signals
At $445.42, INTU trades above its SMA-20 ($422.48) but below both the SMA-50 ($481.64) and SMA-200 ($646.01), indicating short-term relative strength but persistent medium- and long-term selling pressure. The Ichimoku Kijun level sits at $416.10, which is below the current price, marking it as immediate support. Momentum readings are mixed: D1 MACD remains neutral while ADX signals a firm bearish trend. RSI sits in neutral territory, and Stoch RSI suggests neither overbought nor oversold, but BBP is classified as overbought, implying buyers are still exerting some influence despite the day’s decline. The CCI shows a mild bullish reading, but with AO remaining neutral and daily price action down 3.06%, the signals are divergent. There was a moderate gap lower at the open, and the price is now near the low end of today’s trading range, reflecting high intraday volatility and sustained selling pressure after the open.
Downside risk dominates as technicals signal low breakout odds
For the coming week, the projected range for INTU is $430 to $455, maintaining a volatility band relative to current levels. The likelihood of further gains remains very low at less than 20%, while the probability of continued declines is significantly higher, as none of the W1 indicators (RSI, ADX, MACD, MA-50) register a Buy signal. The baseline scenario is for INTU to fluctuate sideways within this band. A bullish outcome requires a break above $455, while a bearish scenario would be triggered on a move below $430 if negative momentum persists.
Earlier, analysts noted that despite Intuit's robust fundamentals and accelerated buybacks, the stock remained under sustained medium- and long-term downside pressure. The latest price action and technical signals reinforce this cautious outlook, suggesting traders should monitor the $430 support level as a potential trigger for further downside momentum if selling persists.


-
 Afghanistan
-
 Albania
-
 Algeria
-
 Angola
-
 Argentina
-
 Armenia
-
 Australia
-
 Austria
-
 Azerbaijan
-
 Bahamas
-
 Bahrain
-
 Bangladesh
-
 Belarus
-
 Belgium
-
 Bolivia
-
 Botswana
-
 Brazil
-
 Brunei
-
 Bulgaria
-
 Cambodia
-
 Cameroon
-
 Canada
-
 Chile
Chile
-
 China
China
-
 Colombia
-
 Congo
Congo
-
 Costa Rica
-
 Cote d'Ivoire
-
 Croatia
-
 Cuba
Cuba
-
 Cyprus
-
 Czechia
-
 DR Congo
-
 Denmark
-
 Dominican Republic
-
 Ecuador
-
 Egypt
Egypt
-
 El Salvador
-
 Estonia
-
 Eswatini
-
 Ethiopia
-
 Finland
-
 France
-
 Georgia
-
 Germany
-
 Ghana
Ghana
-
 Greece
-
 Haiti
Haiti
-
 Hong Kong
-
 Hungary
-
 India
India
-
 Indonesia
-
 Iran, Islamic republic
-
 Iraq
Iraq
-
 Ireland
-
 Israel
-
 Italy
Italy
-
 Jamaica
-
 Japan
Japan
-
 Jordan
-
 Kazakhstan
-
 Kenya
Kenya
-
 Korea
Korea
-
 Kuwait
-
 Kyrgyzstan
-
 Laos
Laos
-
 Latvia
-
 Lebanon
-
 Lesotho
-
 Libya
Libya
-
 Lithuania
-
 Luxembourg
-
 Madagascar
-
 Malaysia
-
 Malta
Malta
-
 Mauritius
-
 Mexico
-
 Moldova
-
 Mongolia
-
 Montenegro
-
 Morocco
-
 Mozambique
-
 Myanmar
-
 Namibia
-
 Nepal
Nepal
-
 Netherlands
-
 New Zealand
-
 Nigeria
-
 North Macedonia
-
 Norway
-
 Oman
Oman
-
 Pakistan
-
 Palestine
-
 Panama
-
 Papua New Guinea
-
 Paraguay
-
 Peru
Peru
-
 Philippines
-
 Poland
-
 Portugal
-
 Puerto Rico
-
 Qatar
Qatar
-
 Reunion
-
 Romania
-
 Rwanda
-
 Saudi Arabia
-
 Serbia
-
 Singapore
-
 Slovakia
-
 Slovenia
-
 Somalia
-
 South Africa
-
 Spain
Spain
-
 Sri Lanka
-
 Sweden
-
 Switzerland
-
 Syria
Syria
-
 Taiwan
-
 Tajikistan
-
 Tanzania
-
 Thailand
-
 Trinidad and Tobago
-
 Tunisia
-
 Turkey
-
 UAE
UAE
-
 Uganda
-
 Ukraine
-
 United Kingdom
-
United States
-
 Uruguay
-
 Uzbekistan
-
 Venezuela
-
 Vietnam
-
 Yemen
Yemen
-
 Zambia
-
 Zimbabwe
- Forex
- Crypto
