
-3.36% for Bit Digital stock as resistance holds below $1.72

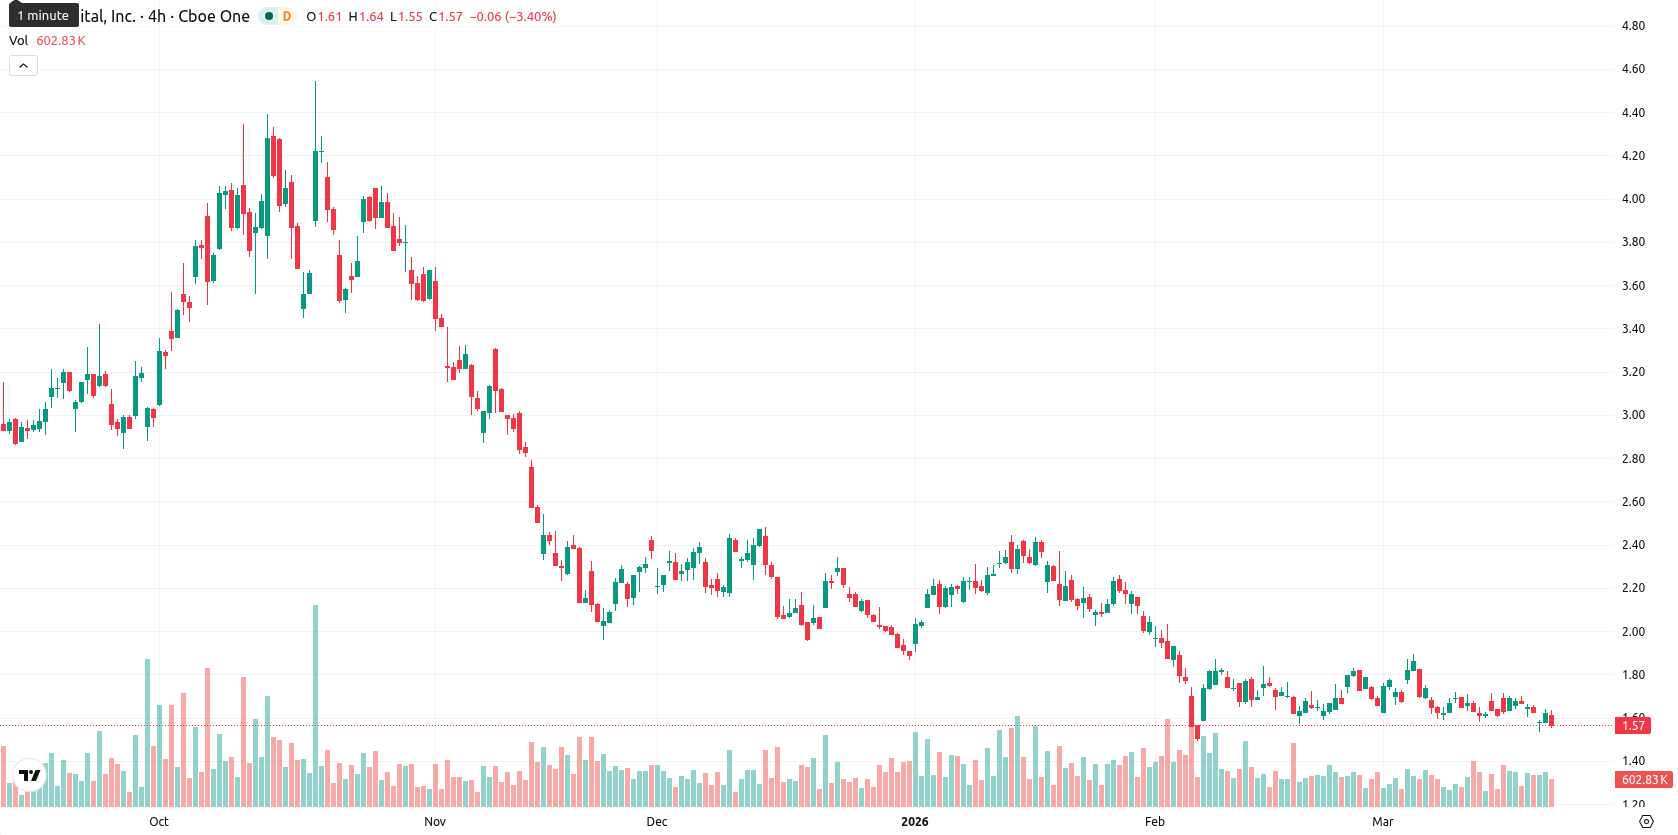
Bit Digital Inc (BTBT) is trading at $1.56 after a session that has seen a daily decline of 3.36%. The price remains below the MA-20 ($1.68), MA-50 ($1.88), and MA-200 ($2.63), confirming persistent weakness across all trend horizons.
Highlights
- BTBT trades below key moving averages across all timeframes, signaling persistent technical weakness and a bearish backdrop.
- Momentum indicators remain negative and sellers dominate intraday, despite oversold signals suggesting only limited potential for a short-term bounce.
- The stock is expected to consolidate between $1.48 and $1.65 in the next five days, with further declines more likely unless $1.72 resistance is breached.
Bearish momentum confirmed as oversold signals counter limited rebound attempts
Technical signals indicate a bearish setup, with BTBT trading underneath key moving averages and encountering immediate resistance at the Ichimoku Kijun level of $1.72. The MACD flashes a strong sell signal, the ADX is low and neutral, and oscillators mark oversold conditions — RSI at 42.59, Stoch RSI at 4.58, and CCI at –126.12 — hinting at possible rebound attempts but showing no clear buying force. Bull/Bear Power (BBP) reflects continued intraday selling pressure, while the Awesome Oscillator stays neutral, and daily momentum aligns with prevailing downside, as the price presses toward the lower end of today’s $1.55 – $1.64 range amid notable volatility.
Downside risks prevail as resistance blocks upside potential
Over the next five trading days, BTBT is likely to consolidate within a typical volatility band of $1.48 to $1.65. Downside risks dominate, and the probability of a sustained upside move is low, with further weakness more likely unless a break above the $1.72 resistance occurs. Should the price fall below $1.48, selling momentum could accelerate, whereas any bullish scenario depends on a confirmed move above that resistance zone.
Earlier, analysts noted that Bit Digital was facing persistent bearish momentum and sustained seller pressure across all timeframes. The current analysis reinforces this downbeat outlook, and traders should closely monitor $1.48 as the critical support level, as a break below it could trigger a further wave of downside acceleration.


Latest Bit Digital News


-
 Afghanistan
-
 Albania
-
 Algeria
-
 Angola
-
 Argentina
-
 Armenia
-
 Australia
-
 Austria
-
 Azerbaijan
-
 Bahamas
-
 Bahrain
-
 Bangladesh
-
 Belarus
-
 Belgium
-
 Bolivia
-
 Botswana
-
 Brazil
-
 Brunei
-
 Bulgaria
-
 Cambodia
-
 Cameroon
-
 Canada
-
 Chile
Chile
-
 China
China
-
 Colombia
-
 Congo
Congo
-
 Costa Rica
-
 Cote d'Ivoire
-
 Croatia
-
 Cuba
Cuba
-
 Cyprus
-
 Czechia
-
 DR Congo
-
 Denmark
-
 Dominican Republic
-
 Ecuador
-
 Egypt
Egypt
-
 El Salvador
-
 Estonia
-
 Eswatini
-
 Ethiopia
-
 Finland
-
 France
-
 Georgia
-
 Germany
-
 Ghana
Ghana
-
 Greece
-
 Haiti
Haiti
-
 Hong Kong
-
 Hungary
-
 India
India
-
 Indonesia
-
 Iran, Islamic republic
-
 Iraq
Iraq
-
 Ireland
-
 Israel
-
 Italy
Italy
-
 Jamaica
-
 Japan
Japan
-
 Jordan
-
 Kazakhstan
-
 Kenya
Kenya
-
 Korea
Korea
-
 Kuwait
-
 Kyrgyzstan
-
 Laos
Laos
-
 Latvia
-
 Lebanon
-
 Lesotho
-
 Libya
Libya
-
 Lithuania
-
 Luxembourg
-
 Madagascar
-
 Malaysia
-
 Malta
Malta
-
 Mauritius
-
 Mexico
-
 Moldova
-
 Mongolia
-
 Montenegro
-
 Morocco
-
 Mozambique
-
 Myanmar
-
 Namibia
-
 Nepal
Nepal
-
 Netherlands
-
 New Zealand
-
 Nigeria
-
 North Macedonia
-
 Norway
-
 Oman
Oman
-
 Pakistan
-
 Palestine
-
 Panama
-
 Papua New Guinea
-
 Paraguay
-
 Peru
Peru
-
 Philippines
-
 Poland
-
 Portugal
-
 Puerto Rico
-
 Qatar
Qatar
-
 Reunion
-
 Romania
-
 Rwanda
-
 Saudi Arabia
-
 Serbia
-
 Singapore
-
 Slovakia
-
 Slovenia
-
 Somalia
-
 South Africa
-
 Spain
Spain
-
 Sri Lanka
-
 Sweden
-
 Switzerland
-
 Syria
Syria
-
 Taiwan
-
 Tajikistan
-
 Tanzania
-
 Thailand
-
 Trinidad and Tobago
-
 Tunisia
-
 Turkey
-
 UAE
UAE
-
 Uganda
-
 Ukraine
-
 United Kingdom
-
United States
-
 Uruguay
-
 Uzbekistan
-
 Venezuela
-
 Vietnam
-
 Yemen
Yemen
-
 Zambia
-
 Zimbabwe
- Forex
- Crypto
