
Tesla stock rises as daily rebound follows weak momentum and Austin chip plans

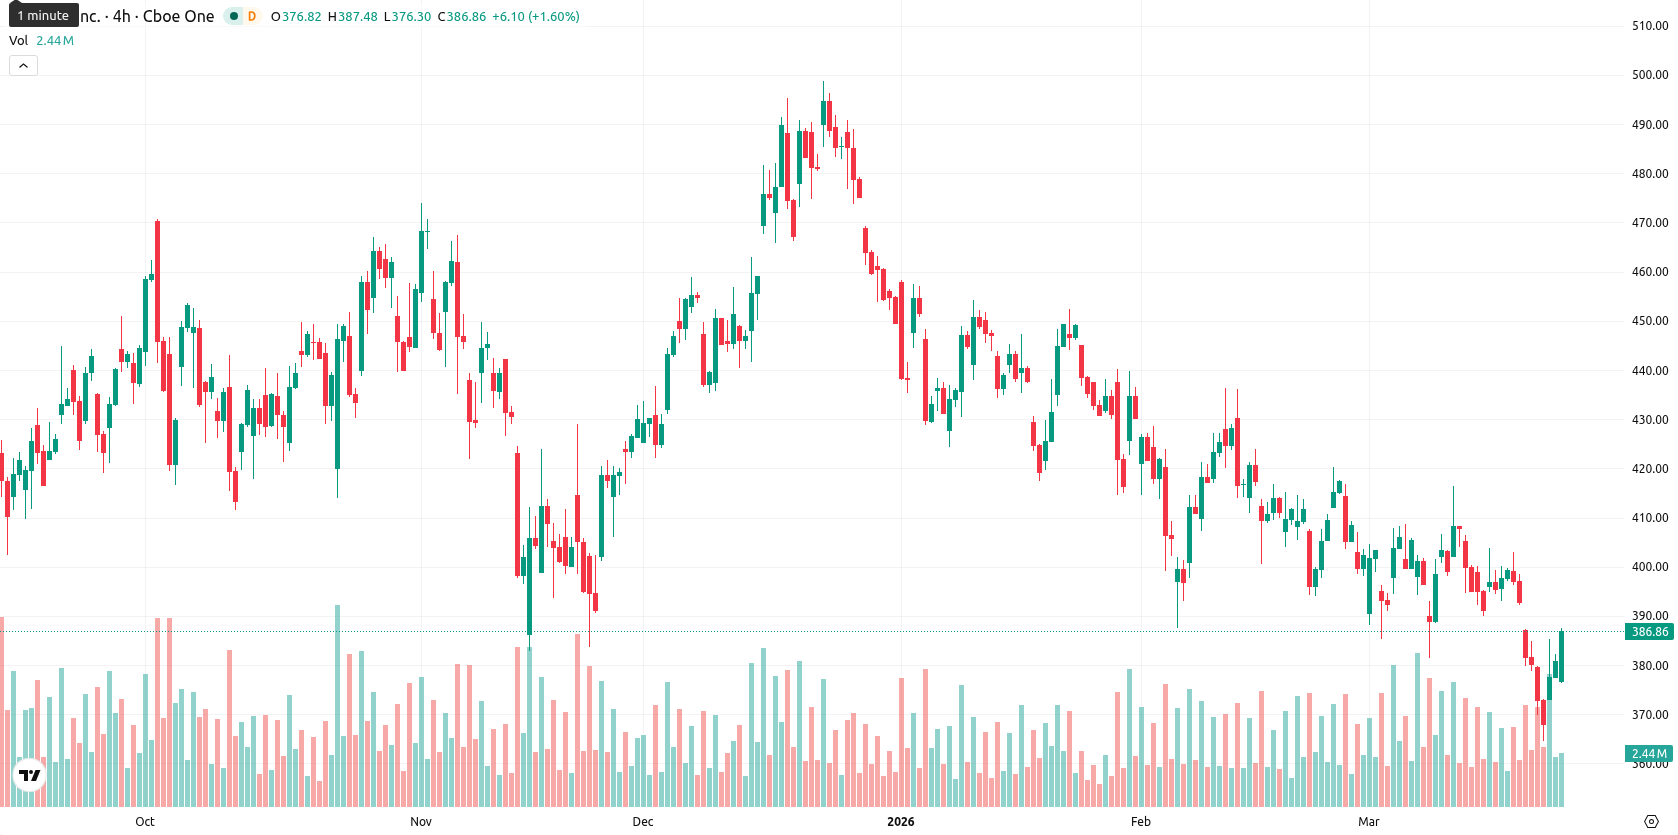
Tesla, Inc. (TSLA) is trading at $386.97, which is below the SMA-20 ($397.52), SMA-50 ($414.19), and SMA-200 ($394.62), signaling persistent selling pressure in the short, medium, and long term. The Ichimoku Kijun level stands at $394.28, marking immediate resistance above the current price.
Highlights
- Tesla announced a $20–$25 billion investment to build an in-house AI chip facility, aiming to start production by late 2027.
- The NHTSA has intensified its investigation into Tesla’s Full Self-Driving system, raising regulatory risks for around 2.4 million vehicles.
- TSLA faces ongoing selling pressure, trades below major moving averages, and is expected to remain range-bound between $374 and $395 with downside risk prevailing.
AI chip facility plans and regulatory probe reshape Tesla outlook
Tesla has unveiled the Terafab project at an event in Austin, Texas, introducing plans to build an in-house AI chip manufacturing facility with an estimated initial investment of $20 billion to $25 billion, targeting late 2027 for chip production. The company stated that its 2026 capital expenditures do not include costs related to Terafab as planning and development begin. Tesla also rolled out a new driver profile feature in its 2026.8 software update, enabling real-time driver visibility via its mobile app, while the NHTSA escalated its probe of Tesla's Full Self-Driving system to a formal Engineering Analysis covering approximately 2.4 million vehicles, increasing regulatory uncertainty and the possibility of a recall.
Bearish momentum persists despite rebound and mixed indicator signals
Momentum remains weak, with MACD and ADX both generating sell signals on the D1 timeframe. RSI is below 50 and accompanied by oversold readings from CCI and BBP, indicating sellers still hold the upper hand, although Stoch RSI displays a strong buy signal and hints at a rebound, revealing a divergence in momentum indicators. The daily session opened with a minor gap down but quickly rebounded, now trading at the top of today’s range ($376.50 – $386.35) on moderate volatility, suggesting renewed intraday strength toward the highs.
Downside risk elevated as breakout chances remain minimal
For the coming week, the expected trading range is $374 – $395. The probability of a price increase is very low (less than 20%), making a further decline more likely. In the baseline scenario, TSLA remains range-bound between immediate resistance and support. On a breakout above $394, a test toward $395 may follow, but ongoing bearish signals suggest this is less probable. A break below $374 could trigger deeper selling, with longer-term moving averages and oscillator readings warning of continued downside risk.
In a recent review, analysts highlighted that Tesla continued to face persistent bearish momentum and elevated downside risk despite its strategic investments in domestic chip production. The current analysis reinforces this negative outlook, emphasizing that market participants should closely monitor any move below the $374 support as a trigger for further weakness amid ongoing regulatory uncertainty and mixed momentum signals.


-
 Afghanistan
-
 Albania
-
 Algeria
-
 Angola
-
 Argentina
-
 Armenia
-
 Australia
-
 Austria
-
 Azerbaijan
-
 Bahamas
-
 Bahrain
-
 Bangladesh
-
 Belarus
-
 Belgium
-
 Bolivia
-
 Botswana
-
 Brazil
-
 Brunei
-
 Bulgaria
-
 Cambodia
-
 Cameroon
-
 Canada
-
 Chile
Chile
-
 China
China
-
 Colombia
-
 Congo
Congo
-
 Costa Rica
-
 Cote d'Ivoire
-
 Croatia
-
 Cuba
Cuba
-
 Cyprus
-
 Czechia
-
 DR Congo
-
 Denmark
-
 Dominican Republic
-
 Ecuador
-
 Egypt
Egypt
-
 El Salvador
-
 Estonia
-
 Eswatini
-
 Ethiopia
-
 Finland
-
 France
-
 Georgia
-
 Germany
-
 Ghana
Ghana
-
 Greece
-
 Haiti
Haiti
-
 Hong Kong
-
 Hungary
-
 India
India
-
 Indonesia
-
 Iran, Islamic republic
-
 Iraq
Iraq
-
 Ireland
-
 Israel
-
 Italy
Italy
-
 Jamaica
-
 Japan
Japan
-
 Jordan
-
 Kazakhstan
-
 Kenya
Kenya
-
 Korea
Korea
-
 Kuwait
-
 Kyrgyzstan
-
 Laos
Laos
-
 Latvia
-
 Lebanon
-
 Lesotho
-
 Libya
Libya
-
 Lithuania
-
 Luxembourg
-
 Madagascar
-
 Malaysia
-
 Malta
Malta
-
 Mauritius
-
 Mexico
-
 Moldova
-
 Mongolia
-
 Montenegro
-
 Morocco
-
 Mozambique
-
 Myanmar
-
 Namibia
-
 Nepal
Nepal
-
 Netherlands
-
 New Zealand
-
 Nigeria
-
 North Macedonia
-
 Norway
-
 Oman
Oman
-
 Pakistan
-
 Palestine
-
 Panama
-
 Papua New Guinea
-
 Paraguay
-
 Peru
Peru
-
 Philippines
-
 Poland
-
 Portugal
-
 Puerto Rico
-
 Qatar
Qatar
-
 Reunion
-
 Romania
-
 Rwanda
-
 Saudi Arabia
-
 Serbia
-
 Singapore
-
 Slovakia
-
 Slovenia
-
 Somalia
-
 South Africa
-
 Spain
Spain
-
 Sri Lanka
-
 Sweden
-
 Switzerland
-
 Syria
Syria
-
 Taiwan
-
 Tajikistan
-
 Tanzania
-
 Thailand
-
 Trinidad and Tobago
-
 Tunisia
-
 Turkey
-
 UAE
UAE
-
 Uganda
-
 Ukraine
-
 United Kingdom
-
United States
-
 Uruguay
-
 Uzbekistan
-
 Venezuela
-
 Vietnam
-
 Yemen
Yemen
-
 Zambia
-
 Zimbabwe
- Forex
- Crypto
