
JetBlue Airways stock soars 15.99% as lawsuit and technical rally boost volatility

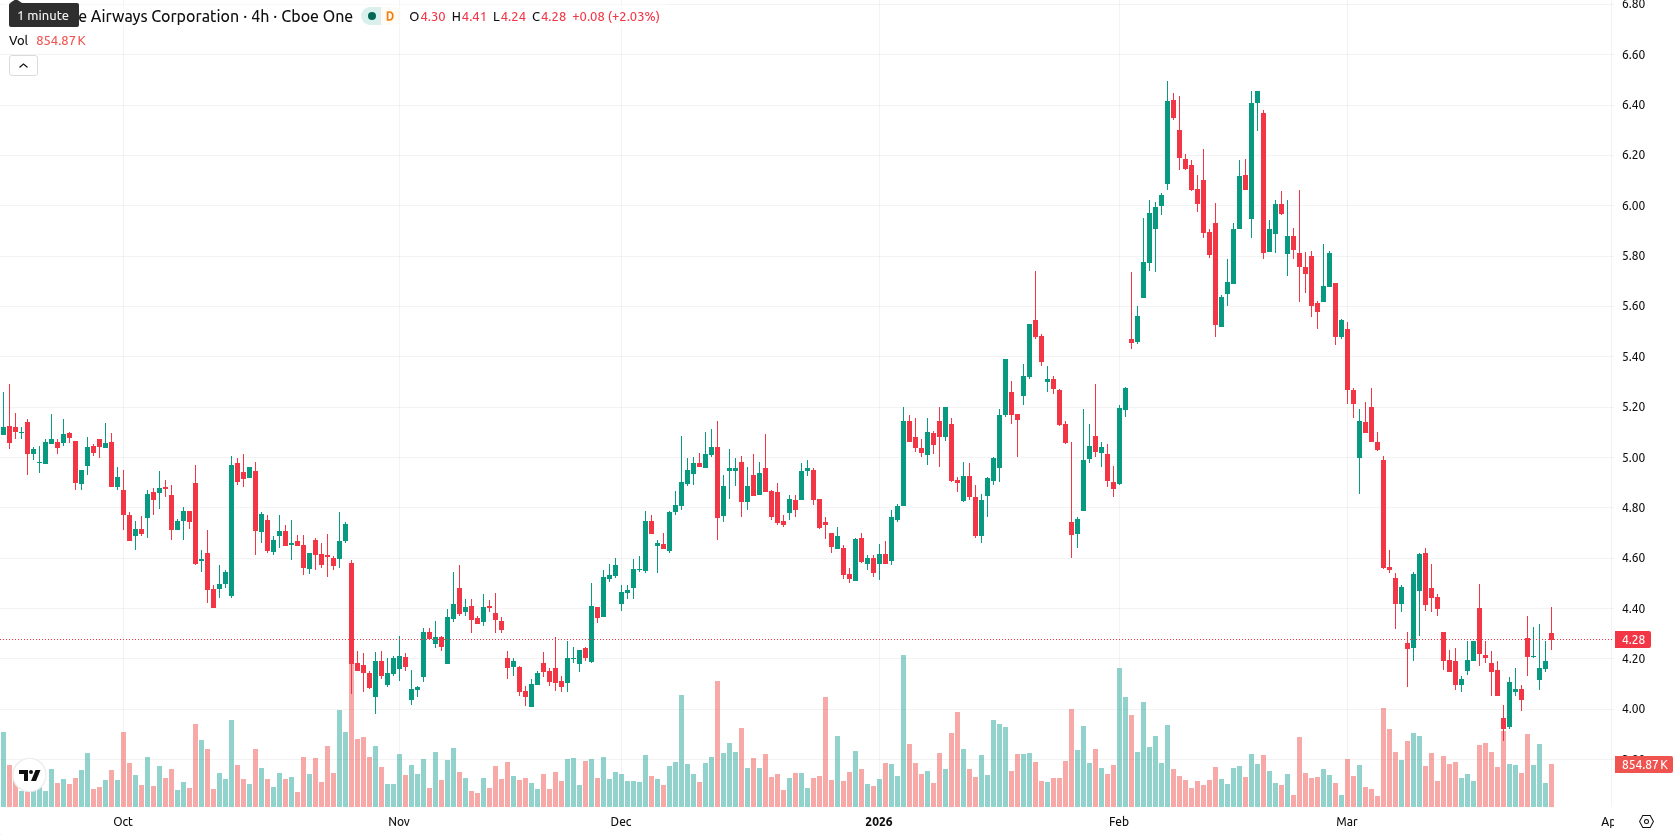
JetBlue Airways Corporation (JBLU) is trading at $4.86, which is above its 20-day SMA ($4.60) but still below the 50-day SMA ($5.16). This setup highlights short-term bullish momentum for JetBlue Airways, while medium- and longer-term trends remain weak with ongoing downward pressure.
Highlights
- JetBlue Airways faces a lawsuit from its pilot union seeking forced arbitration over contractual issues tied to its partnership with United Airlines.
- The interline agreement with United is drawing industry scrutiny as it follows JetBlue's terminated Northeast Alliance with American Airlines.
- JBLU trades near session highs after a strong rally, but mixed technical signals and sell-biased weekly indicators suggest a likely range of $4.35–$5.35 with downside risks.
Pilot lawsuit raises operational risks as partnership faces legal scrutiny
JetBlue Airways pilots, represented by the Air Line Pilots Association (ALPA), have filed a lawsuit against the company in the US District Court for the Eastern District of New York. The legal action seeks to compel JetBlue Airways to fully arbitrate all aspects of a contractual grievance regarding its Blue Sky interline agreement with United Airlines. This partnership announcement has drawn industry comparisons to the previously dissolved Northeast Alliance with American Airlines.
Mixed momentum signals as resistance caps rally and indicators warn
JBLU is showing mixed technical signals. The Ichimoku Kijun at $5.17 is acting as immediate resistance, while the price sits above the 20-day SMA but is still below the 50-day SMA, indicating conflicting momentum across different timeframes. MACD signals strong selling and ADX shows a weak trend, while RSI is at 36 and CCI is negative, both reflecting sell territory without clear oversold signals. Stoch RSI is overbought near 97, indicating possible near-term correction risk, and slightly negative BBP favours sellers intraday despite a sharp rally. A gap up at the open and the price now near session highs underline strong upward price action, though technical indicators warn of underlying caution.
Downside risk grows as weekly signals favor range-bound trading
In the short term, JBLU is expected to trade within a volatility band of $4.35 to $5.35 over the next five sessions, consistent with recent moves and within 10% of current levels. The probability of further price increases is low at less than 20%, as major weekly indicators remain in sell territory and declines are more likely. The base scenario is for JBLU to hold within the $4.35–$5.35 range; a move above $5.17 would indicate breakout potential for more gains, while a drop below $4.35 may accelerate selling momentum.
Earlier, analysts noted that bearish momentum and operational headwinds continued to exert pressure on JetBlue Airways, while new legal uncertainties from the pilots' lawsuit introduced further risk. The current setup reinforces these concerns, with mixed technical signals suggesting investors should closely monitor volatility near the $5.17 resistance level as an upside breakout or downside acceleration may soon materialize.


-
 Afghanistan
-
 Albania
-
 Algeria
-
 Angola
-
 Argentina
-
 Armenia
-
 Australia
-
 Austria
-
 Azerbaijan
-
 Bahamas
-
 Bahrain
-
 Bangladesh
-
 Belarus
-
 Belgium
-
 Bolivia
-
 Botswana
-
 Brazil
-
 Brunei
-
 Bulgaria
-
 Cambodia
-
 Cameroon
-
 Canada
-
 Chile
Chile
-
 China
China
-
 Colombia
-
 Congo
Congo
-
 Costa Rica
-
 Cote d'Ivoire
-
 Croatia
-
 Cuba
Cuba
-
 Cyprus
-
 Czechia
-
 DR Congo
-
 Denmark
-
 Dominican Republic
-
 Ecuador
-
 Egypt
Egypt
-
 El Salvador
-
 Estonia
-
 Eswatini
-
 Ethiopia
-
 Finland
-
 France
-
 Georgia
-
 Germany
-
 Ghana
Ghana
-
 Greece
-
 Haiti
Haiti
-
 Hong Kong
-
 Hungary
-
 India
India
-
 Indonesia
-
 Iran, Islamic republic
-
 Iraq
Iraq
-
 Ireland
-
 Israel
-
 Italy
Italy
-
 Jamaica
-
 Japan
Japan
-
 Jordan
-
 Kazakhstan
-
 Kenya
Kenya
-
 Korea
Korea
-
 Kuwait
-
 Kyrgyzstan
-
 Laos
Laos
-
 Latvia
-
 Lebanon
-
 Lesotho
-
 Libya
Libya
-
 Lithuania
-
 Luxembourg
-
 Madagascar
-
 Malaysia
-
 Malta
Malta
-
 Mauritius
-
 Mexico
-
 Moldova
-
 Mongolia
-
 Montenegro
-
 Morocco
-
 Mozambique
-
 Myanmar
-
 Namibia
-
 Nepal
Nepal
-
 Netherlands
-
 New Zealand
-
 Nigeria
-
 North Macedonia
-
 Norway
-
 Oman
Oman
-
 Pakistan
-
 Palestine
-
 Panama
-
 Papua New Guinea
-
 Paraguay
-
 Peru
Peru
-
 Philippines
-
 Poland
-
 Portugal
-
 Puerto Rico
-
 Qatar
Qatar
-
 Reunion
-
 Romania
-
 Rwanda
-
 Saudi Arabia
-
 Serbia
-
 Singapore
-
 Slovakia
-
 Slovenia
-
 Somalia
-
 South Africa
-
 Spain
Spain
-
 Sri Lanka
-
 Sweden
-
 Switzerland
-
 Syria
Syria
-
 Taiwan
-
 Tajikistan
-
 Tanzania
-
 Thailand
-
 Trinidad and Tobago
-
 Tunisia
-
 Turkey
-
 UAE
UAE
-
 Uganda
-
 Ukraine
-
 United Kingdom
-
United States
-
 Uruguay
-
 Uzbekistan
-
 Venezuela
-
 Vietnam
-
 Yemen
Yemen
-
 Zambia
-
 Zimbabwe
- Forex
- Crypto
