
Sundial Growers stock rises as technical divergence defines tight trading range

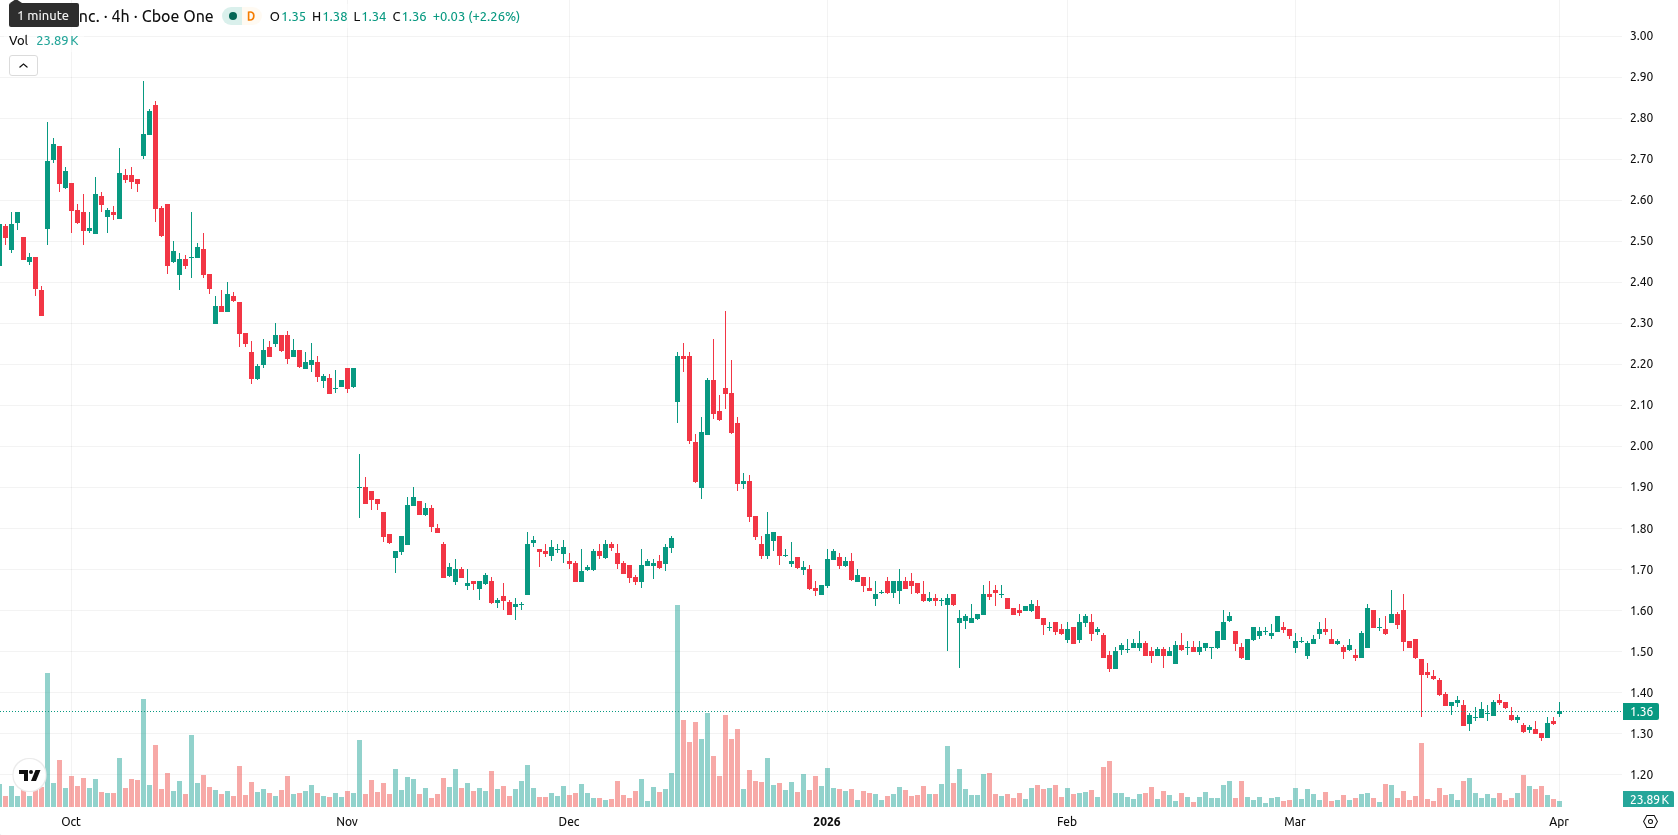
Sundial Growers Inc. (SNDL) is trading at $1.36, up 2.26% on the day. The stock remains below key moving averages — SMA-20 at $1.43, SMA-50 at $1.50, and SMA-200 at $1.82 — underscoring continued downward pressure across short-, medium-, and long-term horizons.
Highlights
- SNDL trades below key moving averages, reflecting persistent bearish pressure across short and long-term timeframes.
- Technical momentum signals skew bearish to near oversold, despite mild intraday uptick and low volatility after the open.
- Baseline outlook is sideways within a $1.32–$1.40 range, with a sub-20% probability of sustained upside absent a break above $1.47.
Mixed oscillator signals as resistance limits upward momentum
The Ichimoku Kijun level sits at $1.47, marking immediate resistance. Momentum indicators paint a mixed picture: D1 MACD is at –0.08 with a sell bias and ADX at 22.28 shows no strong trend. The D1 RSI at 34.76 and CCI at –85.30 indicate the stock is near oversold, while Stoch RSI signals a strong buy, reflecting divergence among oscillators. Intraday, BBP remains slightly negative, AO also supports a bearish setup, and today’s price action has been confined to a tight $1.35–$1.37 range with low volatility and a mild upward bias after the open.
Sideways trade likely as technical signals favor further weakness
Over the next five trading days, SNDL is expected to stay within a volatility band between $1.32 and $1.40. With weekly indicators (RSI, ADX, MACD, and MA-50) maintaining a sell or neutral stance, there is less than a 20% probability of a notable price increase, suggesting further declines remain likely. The baseline scenario calls for sideways consolidation in the stated range; a bullish reversal would require a close above $1.47, while a drop below $1.32 could trigger deeper losses.
Earlier, analysts noted that Sundial Growers continued to face persistent bearish momentum amid weak technical signals. The current analysis reinforces this outlook as the stock remains under pressure, and traders should closely monitor price action around the $1.32 support for signs of a potential breakdown or stabilization.


-
 Afghanistan
-
 Albania
-
 Algeria
-
 Angola
-
 Argentina
-
 Armenia
-
 Australia
-
 Austria
-
 Azerbaijan
-
 Bahamas
-
 Bahrain
-
 Bangladesh
-
 Belarus
-
 Belgium
-
 Bolivia
-
 Botswana
-
 Brazil
-
 Brunei
-
 Bulgaria
-
 Cambodia
-
 Cameroon
-
 Canada
-
 Chile
Chile
-
 China
China
-
 Colombia
-
 Congo
Congo
-
 Costa Rica
-
 Cote d'Ivoire
-
 Croatia
-
 Cuba
Cuba
-
 Cyprus
-
 Czechia
-
 DR Congo
-
 Denmark
-
 Dominican Republic
-
 Ecuador
-
 Egypt
Egypt
-
 El Salvador
-
 Estonia
-
 Eswatini
-
 Ethiopia
-
 Finland
-
 France
-
 Georgia
-
 Germany
-
 Ghana
Ghana
-
 Greece
-
 Haiti
Haiti
-
 Hong Kong
-
 Hungary
-
 India
India
-
 Indonesia
-
 Iran, Islamic republic
-
 Iraq
Iraq
-
 Ireland
-
 Israel
-
 Italy
Italy
-
 Jamaica
-
 Japan
Japan
-
 Jordan
-
 Kazakhstan
-
 Kenya
Kenya
-
 Korea
Korea
-
 Kuwait
-
 Kyrgyzstan
-
 Laos
Laos
-
 Latvia
-
 Lebanon
-
 Lesotho
-
 Libya
Libya
-
 Lithuania
-
 Luxembourg
-
 Madagascar
-
 Malaysia
-
 Malta
Malta
-
 Mauritius
-
 Mexico
-
 Moldova
-
 Mongolia
-
 Montenegro
-
 Morocco
-
 Mozambique
-
 Myanmar
-
 Namibia
-
 Nepal
Nepal
-
 Netherlands
-
 New Zealand
-
 Nigeria
-
 North Macedonia
-
 Norway
-
 Oman
Oman
-
 Pakistan
-
 Palestine
-
 Panama
-
 Papua New Guinea
-
 Paraguay
-
 Peru
Peru
-
 Philippines
-
 Poland
-
 Portugal
-
 Puerto Rico
-
 Qatar
Qatar
-
 Reunion
-
 Romania
-
 Rwanda
-
 Saudi Arabia
-
 Serbia
-
 Singapore
-
 Slovakia
-
 Slovenia
-
 Somalia
-
 South Africa
-
 Spain
Spain
-
 Sri Lanka
-
 Sweden
-
 Switzerland
-
 Syria
Syria
-
 Taiwan
-
 Tajikistan
-
 Tanzania
-
 Thailand
-
 Trinidad and Tobago
-
 Tunisia
-
 Turkey
-
 UAE
UAE
-
 Uganda
-
 Ukraine
-
 United Kingdom
-
United States
-
 Uruguay
-
 Uzbekistan
-
 Venezuela
-
 Vietnam
-
 Yemen
Yemen
-
 Zambia
-
 Zimbabwe
- Forex
- Crypto
