
Hut 8 stock up 3.48% as technical indicators point to possible rally after volatility spike

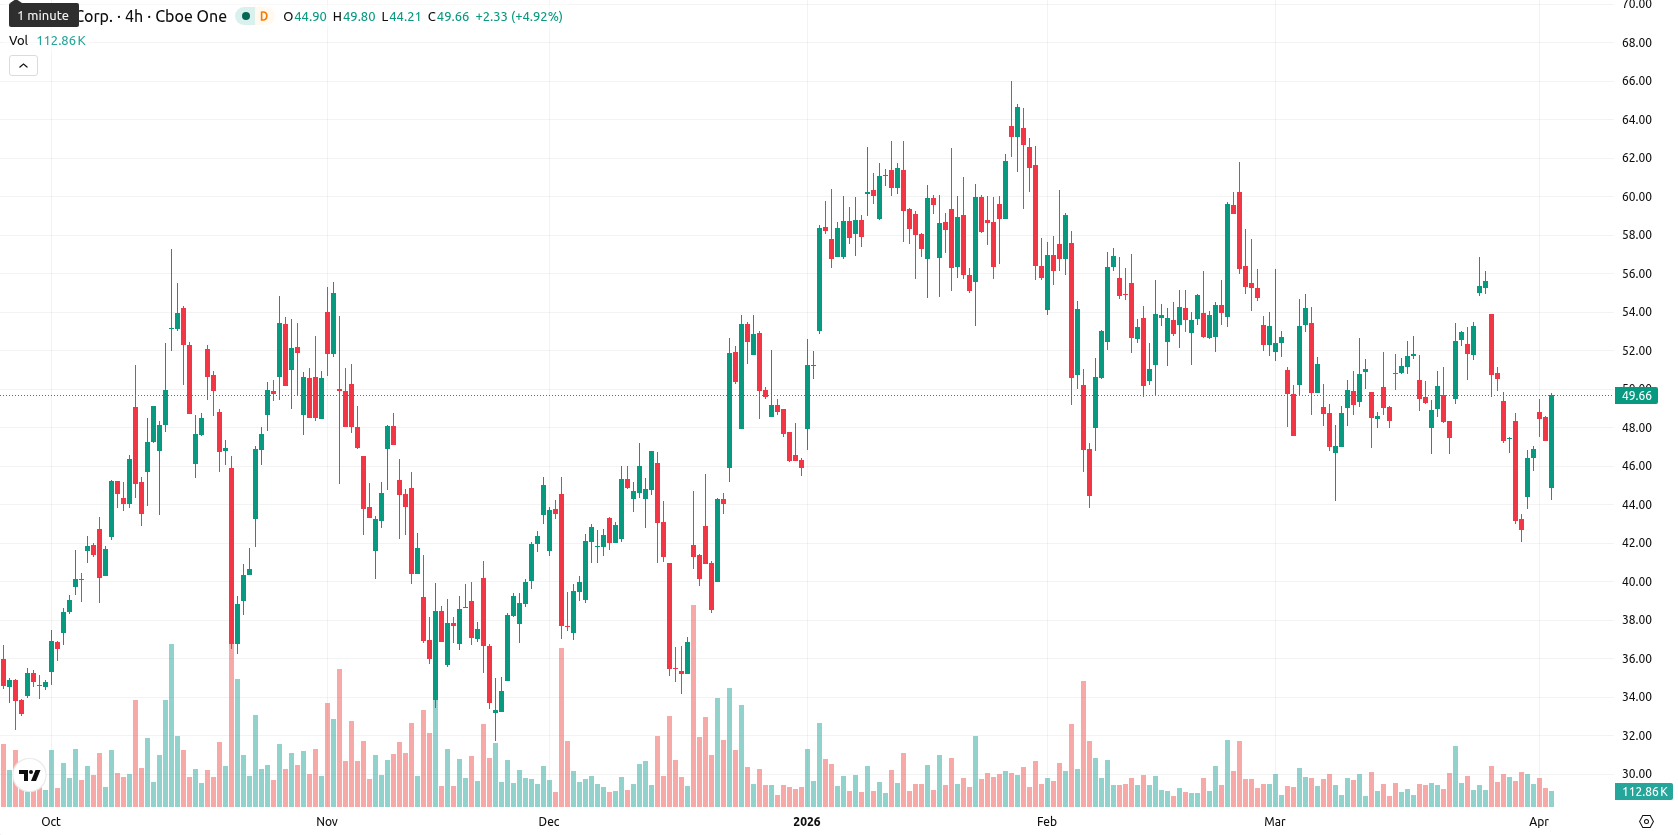
Hut 8 Corp (HUT) is trading at $49.01, up 3.48% for the day. The stock sits slightly below its SMA-20 ($49.55) and well under the SMA-50 ($52.93), but remains significantly above the SMA-200 ($39.84), reflecting persistent short- and medium-term selling pressure while the longer-term trend holds underlying support.
Highlights
- HUT trades below key short- and medium-term moving averages, indicating ongoing selling pressure despite robust long-term support.
- Daily momentum and trend indicators remain weak and neutral, though intraday volatility elevated with recent sessions closing strong near highs.
- For the week ahead, expect consolidation between $44.00 and $52.00, with a high probability of price stabilization or upside if resistance at $51.94 is cleared.
Momentum weakens as volatility rises near technical barriers
Daily momentum is weak, with the MACD signaling a sell and a low ADX (8.51) indicating a lack of strong trend direction. RSI (45.71), CCI (–54.63), and Stoch RSI (40.69, neutral) show neither overbought nor oversold conditions, but BBP reads as "Oversold," indicating sellers are dominating intraday action. The Ichimoku Kijun at $51.94 acts as immediate resistance for HUT, while current price action near the top of today’s range ($45.93 – $48.32) signals high intraday volatility and strong interest into the close. The price remains within a firm band established by SMA and Ichimoku levels.
Rally probability increases as major indicators flag upside risk
For the upcoming week, HUT is likely to trade within a typical volatility band between $44.00 and $52.00, consistent with recent price swings. Technical signals show a high probability of upward movement, as three out of four major weekly indicators — MACD, RSI, and MA-50 — point to a potential rally. A decisive move above $51.94 would open the door for further gains, while a drop below $44.00 could trigger renewed selling. Sideways consolidation between support and resistance remains the central expectation.
Earlier, analysts noted that Hut 8 was experiencing persistent short-term selling pressure within a longer-term supportive trend, with heightened volatility and the possibility of gains if resistance levels were cleared. The current technical setup reinforces this outlook, highlighting that a sustained move above $51.94 would be a pivotal signal for a broader breakout, while failure to do so keeps risk tilted toward continued consolidation.


Latest Hut 8 News


-
 Afghanistan
-
 Albania
-
 Algeria
-
 Angola
-
 Argentina
-
 Armenia
-
 Australia
-
 Austria
-
 Azerbaijan
-
 Bahamas
-
 Bahrain
-
 Bangladesh
-
 Belarus
-
 Belgium
-
 Bolivia
-
 Botswana
-
 Brazil
-
 Brunei
-
 Bulgaria
-
 Cambodia
-
 Cameroon
-
 Canada
-
 Chile
Chile
-
 China
China
-
 Colombia
-
 Congo
Congo
-
 Costa Rica
-
 Cote d'Ivoire
-
 Croatia
-
 Cuba
Cuba
-
 Cyprus
-
 Czechia
-
 DR Congo
-
 Denmark
-
 Dominican Republic
-
 Ecuador
-
 Egypt
Egypt
-
 El Salvador
-
 Estonia
-
 Eswatini
-
 Ethiopia
-
 Finland
-
 France
-
 Georgia
-
 Germany
-
 Ghana
Ghana
-
 Greece
-
 Haiti
Haiti
-
 Hong Kong
-
 Hungary
-
 India
India
-
 Indonesia
-
 Iran, Islamic republic
-
 Iraq
Iraq
-
 Ireland
-
 Israel
-
 Italy
Italy
-
 Jamaica
-
 Japan
Japan
-
 Jordan
-
 Kazakhstan
-
 Kenya
Kenya
-
 Korea
Korea
-
 Kuwait
-
 Kyrgyzstan
-
 Laos
Laos
-
 Latvia
-
 Lebanon
-
 Lesotho
-
 Libya
Libya
-
 Lithuania
-
 Luxembourg
-
 Madagascar
-
 Malaysia
-
 Malta
Malta
-
 Mauritius
-
 Mexico
-
 Moldova
-
 Mongolia
-
 Montenegro
-
 Morocco
-
 Mozambique
-
 Myanmar
-
 Namibia
-
 Nepal
Nepal
-
 Netherlands
-
 New Zealand
-
 Nigeria
-
 North Macedonia
-
 Norway
-
 Oman
Oman
-
 Pakistan
-
 Palestine
-
 Panama
-
 Papua New Guinea
-
 Paraguay
-
 Peru
Peru
-
 Philippines
-
 Poland
-
 Portugal
-
 Puerto Rico
-
 Qatar
Qatar
-
 Reunion
-
 Romania
-
 Rwanda
-
 Saudi Arabia
-
 Serbia
-
 Singapore
-
 Slovakia
-
 Slovenia
-
 Somalia
-
 South Africa
-
 Spain
Spain
-
 Sri Lanka
-
 Sweden
-
 Switzerland
-
 Syria
Syria
-
 Taiwan
-
 Tajikistan
-
 Tanzania
-
 Thailand
-
 Trinidad and Tobago
-
 Tunisia
-
 Turkey
-
 UAE
UAE
-
 Uganda
-
 Ukraine
-
 United Kingdom
-
United States
-
 Uruguay
-
 Uzbekistan
-
 Venezuela
-
 Vietnam
-
 Yemen
Yemen
-
 Zambia
-
 Zimbabwe
- Forex
- Crypto
