
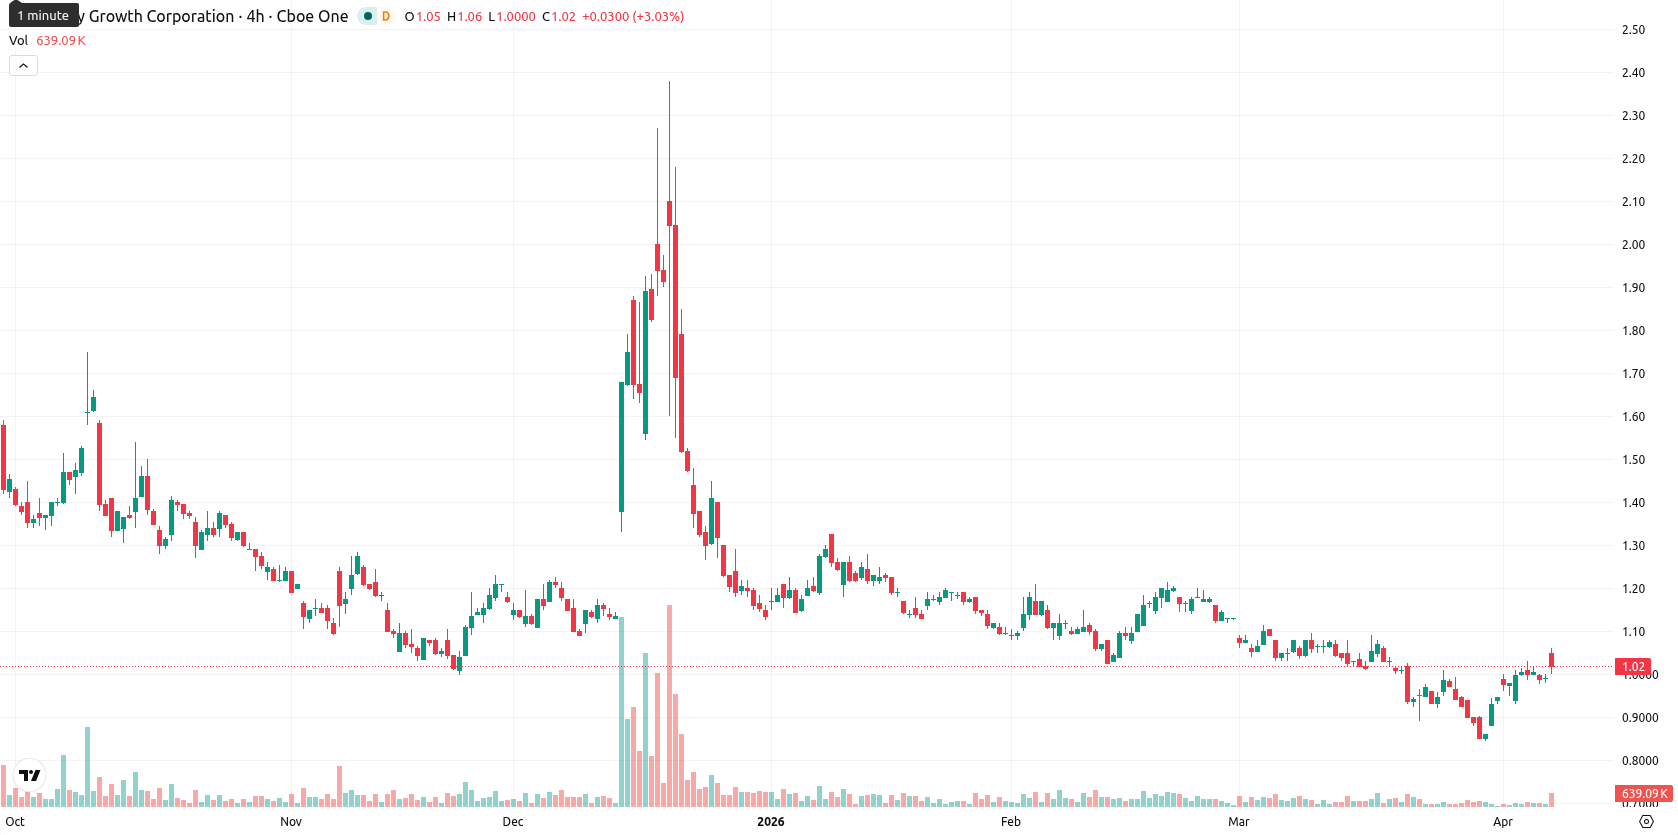
+3.32% for Canopy Growth stock as price remains well below long-term average

Canopy Growth Corporation (CGC) is trading at $1.03, gaining 3.32% on the day. The current price is above both the SMA-20 ($0.99) and Ichimoku Kijun ($0.98), but remains below the SMA-50 ($1.06) and well under the SMA-200 ($1.23).
Highlights
- CGC shows short-term bullish momentum as price holds above immediate support but remains pressured below medium- and long-term averages.
- Momentum indicators are mixed, with overbought oscillators signaling an overextended rally and weak conviction in trend direction.
- Price is expected to consolidate between $1.00 and $1.06 over the next five trading days, with a higher likelihood of decline.
Conflicting momentum with overbought signals raising reversal risk
Momentum indicators on D1 are conflicting: MACD signals strong sell while ADX is neutral, denoting weak trend conviction. RSI is just under neutral at 47.86, CCI is neutral, and Stoch RSI is overbought, suggesting the recent upward move may be overextended. BBP shows persistent buyer dominance (strong buy), reflecting today’s gain of 3.32% with the current price hovering just below today’s high in a moderately volatile session. The open at $1.04 was above the previous close ($0.9921), indicating a small bullish gap, and intraday activity has favored strength toward the highs; however, the divergence between overbought oscillators and persistent buyer momentum points to potential for short-term mean reversion or sideways action.
Downside bias dominates as technical consensus signals weak upside
For the next five trading days, the expected normalized range is $1.00–$1.06, as this aligns with historical volatility and price positioning. The probability of further price increases is very low (less than 20%), with a decline more likely, given the consensus of sell signals across D1 and W1 MACD, RSI, and higher timeframe MAs. Baseline scenario: the price consolidates between $1.00 and $1.06. In a bullish scenario, a push above $1.06 would open room toward higher resistance, while a bearish break below $1.00 could trigger renewed downside momentum.
Earlier, analysts noted that Canopy Growth was facing persistent bearish momentum with little sign of an imminent reversal. While the current upward move introduces some buyer strength, short-term traders should be alert for potential mean reversion or consolidation, with $1.00 serving as a critical pivot level to monitor in the days ahead.


Latest Canopy Growth News


-
 Afghanistan
-
 Albania
-
 Algeria
-
 Angola
-
 Argentina
-
 Armenia
-
 Australia
-
 Austria
-
 Azerbaijan
-
 Bahamas
-
 Bahrain
-
 Bangladesh
-
 Belarus
-
 Belgium
-
 Bolivia
-
 Botswana
-
 Brazil
-
 Brunei
-
 Bulgaria
-
 Cambodia
-
 Cameroon
-
 Canada
-
 Chile
Chile
-
 China
China
-
 Colombia
-
 Congo
Congo
-
 Costa Rica
-
 Cote d'Ivoire
-
 Croatia
-
 Cuba
Cuba
-
 Cyprus
-
 Czechia
-
 DR Congo
-
 Denmark
-
 Dominican Republic
-
 Ecuador
-
 Egypt
Egypt
-
 El Salvador
-
 Estonia
-
 Eswatini
-
 Ethiopia
-
 Finland
-
 France
-
 Georgia
-
 Germany
-
 Ghana
Ghana
-
 Greece
-
 Haiti
Haiti
-
 Hong Kong
-
 Hungary
-
 India
India
-
 Indonesia
-
 Iran, Islamic republic
-
 Iraq
Iraq
-
 Ireland
-
 Israel
-
 Italy
Italy
-
 Jamaica
-
 Japan
Japan
-
 Jordan
-
 Kazakhstan
-
 Kenya
Kenya
-
 Korea
Korea
-
 Kuwait
-
 Kyrgyzstan
-
 Laos
Laos
-
 Latvia
-
 Lebanon
-
 Lesotho
-
 Libya
Libya
-
 Lithuania
-
 Luxembourg
-
 Madagascar
-
 Malaysia
-
 Malta
Malta
-
 Mauritius
-
 Mexico
-
 Moldova
-
 Mongolia
-
 Montenegro
-
 Morocco
-
 Mozambique
-
 Myanmar
-
 Namibia
-
 Nepal
Nepal
-
 Netherlands
-
 New Zealand
-
 Nigeria
-
 North Macedonia
-
 Norway
-
 Oman
Oman
-
 Pakistan
-
 Palestine
-
 Panama
-
 Papua New Guinea
-
 Paraguay
-
 Peru
Peru
-
 Philippines
-
 Poland
-
 Portugal
-
 Puerto Rico
-
 Qatar
Qatar
-
 Reunion
-
 Romania
-
 Rwanda
-
 Saudi Arabia
-
 Serbia
-
 Singapore
-
 Slovakia
-
 Slovenia
-
 Somalia
-
 South Africa
-
 Spain
Spain
-
 Sri Lanka
-
 Sweden
-
 Switzerland
-
 Syria
Syria
-
 Taiwan
-
 Tajikistan
-
 Tanzania
-
 Thailand
-
 Trinidad and Tobago
-
 Tunisia
-
 Turkey
-
 UAE
UAE
-
 Uganda
-
 Ukraine
-
 United Kingdom
-
United States
-
 Uruguay
-
 Uzbekistan
-
 Venezuela
-
 Vietnam
-
 Yemen
Yemen
-
 Zambia
-
 Zimbabwe
- Forex
- Crypto
