
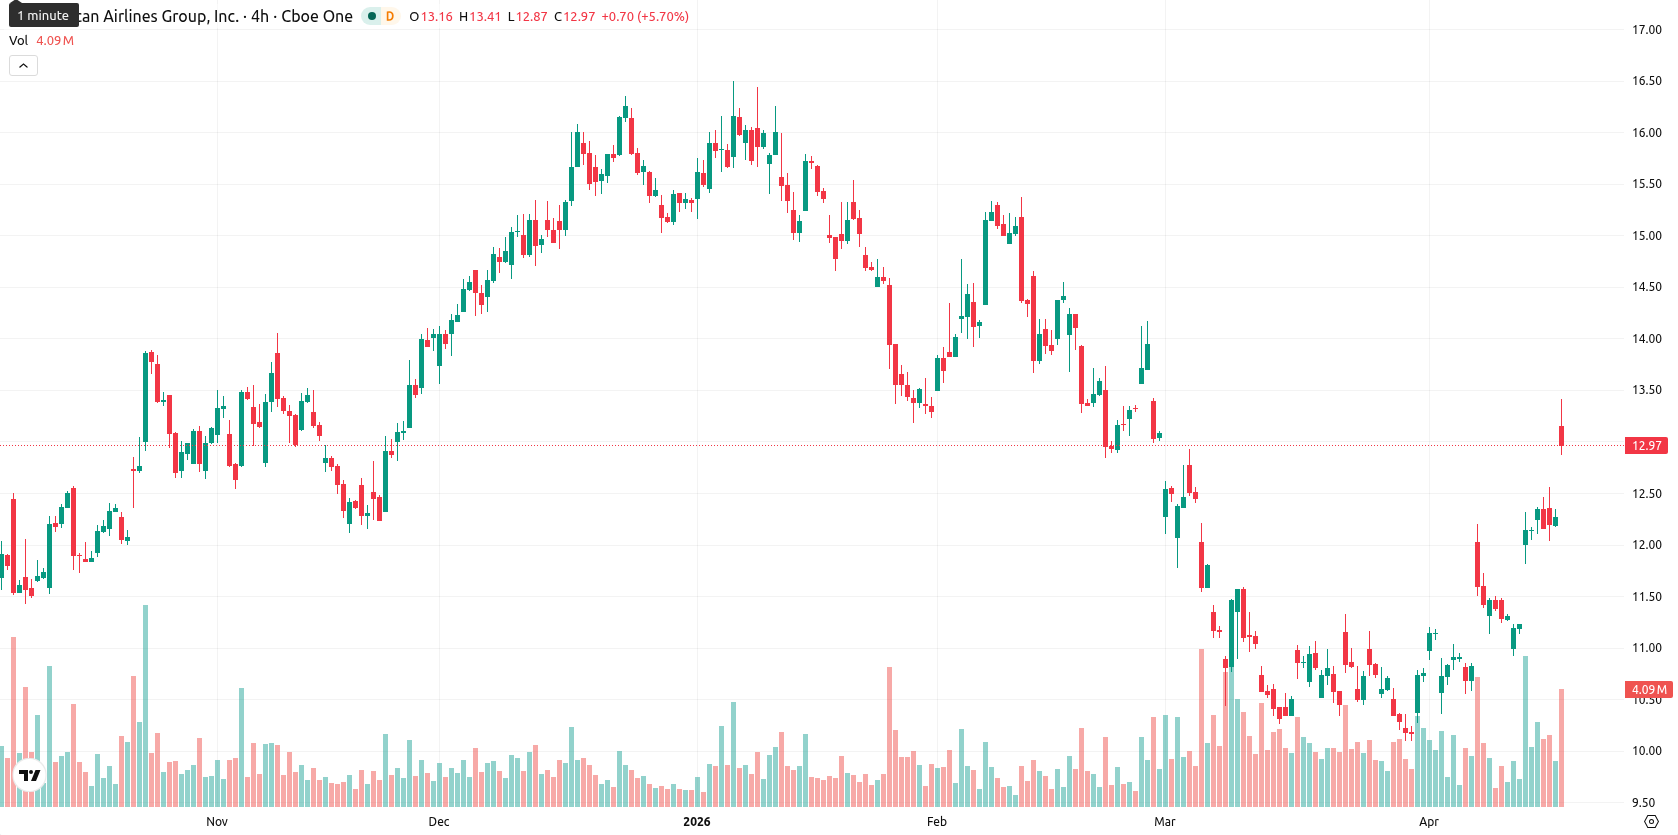
United Airlines merger discussion drives American Airlines stock up 5.18%

American Airlines Group (AAL) is trading at $12.91, above both the SMA-20 ($11.05) and SMA-50 ($12.12), which signals short- and medium-term bullishness. However, it sits just below the SMA-200 ($12.93), suggesting longer-term resistance remains, while the Ichimoku Kijun at $11.32 now acts as immediate support.
Highlights
- United Airlines and American Airlines are reportedly discussing a potential merger in response to escalating jet fuel costs.
- Industry analysts project that a merger between these major carriers would create wide-reaching operational impacts across U.S. airports.
- AAL currently consolidates in a volatile range of $12.56 to $13.16, with technical indicators showing overbought conditions and likely short-term downside pressure.
Merger speculation rises as jet fuel costs drive industry talks
Reports this week indicate ongoing discussions of potential merger activity between American Airlines and United Airlines, following Bloomberg's coverage that United Airlines is considering a merger with American Airlines due to rising jet fuel costs. Additional industry reports note that such a merger would significantly impact U.S. airports.
Overbought momentum signals spark caution amid high price volatility
Momentum indicators show mixed signals: D1 ADX (20.04) and MACD (neutral at 0.17) point to modest upward momentum, but overbought conditions are seen in Stoch RSI (100) and CCI (174), with RSI (61.6) holding in the bullish region. BBP (1.07, overbought) confirms strong buyer dominance intraday, while AO is also supportive of recent gains. Price jumped strongly at the open, creating a gap up from the previous close ($12.27 to $13.11), and is currently trading mid-range after pulling back from intraday highs, with volatility best described as high and the tone shifting to consolidation after early strength. The overbought signals conflict with persistent momentum, highlighting a short-term divergence where traders should be cautious of potential pullbacks.
Downside bias expected as weekly indicators remain broadly bearish
For the next five trading days, the likely price range is $12.56 to $13.16, with $12.91 as a pivot. The probability of an upward move is very low (less than 20%), making a downturn more likely given the persistently bearish W1 signals across MA-50, MA-100, MA-200, RSI, and MACD. The baseline scenario is for price to consolidate sideways within this volatility band relative to current levels. A breakout above $13.16 would signal a bullish reversal, while a drop below $12.56 may trigger renewed downside pressure.
Earlier, analysts noted that despite short-term buying interest in American Airlines shares, upside potential was limited by persistent resistance and mixed technical signals. The current setup reinforces this cautious stance, as ongoing overbought conditions and low probability of further gains suggest traders should monitor $13.16 for a breakout or $12.56 for renewed downside risk in the days ahead.


Latest American Airlines News


-
 Afghanistan
-
 Albania
-
 Algeria
-
 Angola
-
 Argentina
-
 Armenia
-
 Australia
-
 Austria
-
 Azerbaijan
-
 Bahamas
-
 Bahrain
-
 Bangladesh
-
 Belarus
-
 Belgium
-
 Bolivia
-
 Botswana
-
 Brazil
-
 Brunei
-
 Bulgaria
-
 Cambodia
-
 Cameroon
-
 Canada
-
 Chile
Chile
-
 China
China
-
 Colombia
-
 Congo
Congo
-
 Costa Rica
-
 Cote d'Ivoire
-
 Croatia
-
 Cuba
Cuba
-
 Cyprus
-
 Czechia
-
 DR Congo
-
 Denmark
-
 Dominican Republic
-
 Ecuador
-
 Egypt
Egypt
-
 El Salvador
-
 Estonia
-
 Eswatini
-
 Ethiopia
-
 Finland
-
 France
-
 Georgia
-
 Germany
-
 Ghana
Ghana
-
 Greece
-
 Haiti
Haiti
-
 Hong Kong
-
 Hungary
-
 India
India
-
 Indonesia
-
 Iran, Islamic republic
-
 Iraq
Iraq
-
 Ireland
-
 Israel
-
 Italy
Italy
-
 Jamaica
-
 Japan
Japan
-
 Jordan
-
 Kazakhstan
-
 Kenya
Kenya
-
 Korea
Korea
-
 Kuwait
-
 Kyrgyzstan
-
 Laos
Laos
-
 Latvia
-
 Lebanon
-
 Lesotho
-
 Libya
Libya
-
 Lithuania
-
 Luxembourg
-
 Madagascar
-
 Malaysia
-
 Malta
Malta
-
 Mauritius
-
 Mexico
-
 Moldova
-
 Mongolia
-
 Montenegro
-
 Morocco
-
 Mozambique
-
 Myanmar
-
 Namibia
-
 Nepal
Nepal
-
 Netherlands
-
 New Zealand
-
 Nigeria
-
 North Macedonia
-
 Norway
-
 Oman
Oman
-
 Pakistan
-
 Palestine
-
 Panama
-
 Papua New Guinea
-
 Paraguay
-
 Peru
Peru
-
 Philippines
-
 Poland
-
 Portugal
-
 Puerto Rico
-
 Qatar
Qatar
-
 Reunion
-
 Romania
-
 Rwanda
-
 Saudi Arabia
-
 Serbia
-
 Singapore
-
 Slovakia
-
 Slovenia
-
 Somalia
-
 South Africa
-
 Spain
Spain
-
 Sri Lanka
-
 Sweden
-
 Switzerland
-
 Syria
Syria
-
 Taiwan
-
 Tajikistan
-
 Tanzania
-
 Thailand
-
 Trinidad and Tobago
-
 Tunisia
-
 Turkey
-
 UAE
UAE
-
 Uganda
-
 Ukraine
-
 United Kingdom
-
United States
-
 Uruguay
-
 Uzbekistan
-
 Venezuela
-
 Vietnam
-
 Yemen
Yemen
-
 Zambia
-
 Zimbabwe
- Forex
- Crypto
