
American Airlines stock advances after electronic boarding gates launched at Dallas Fort Worth

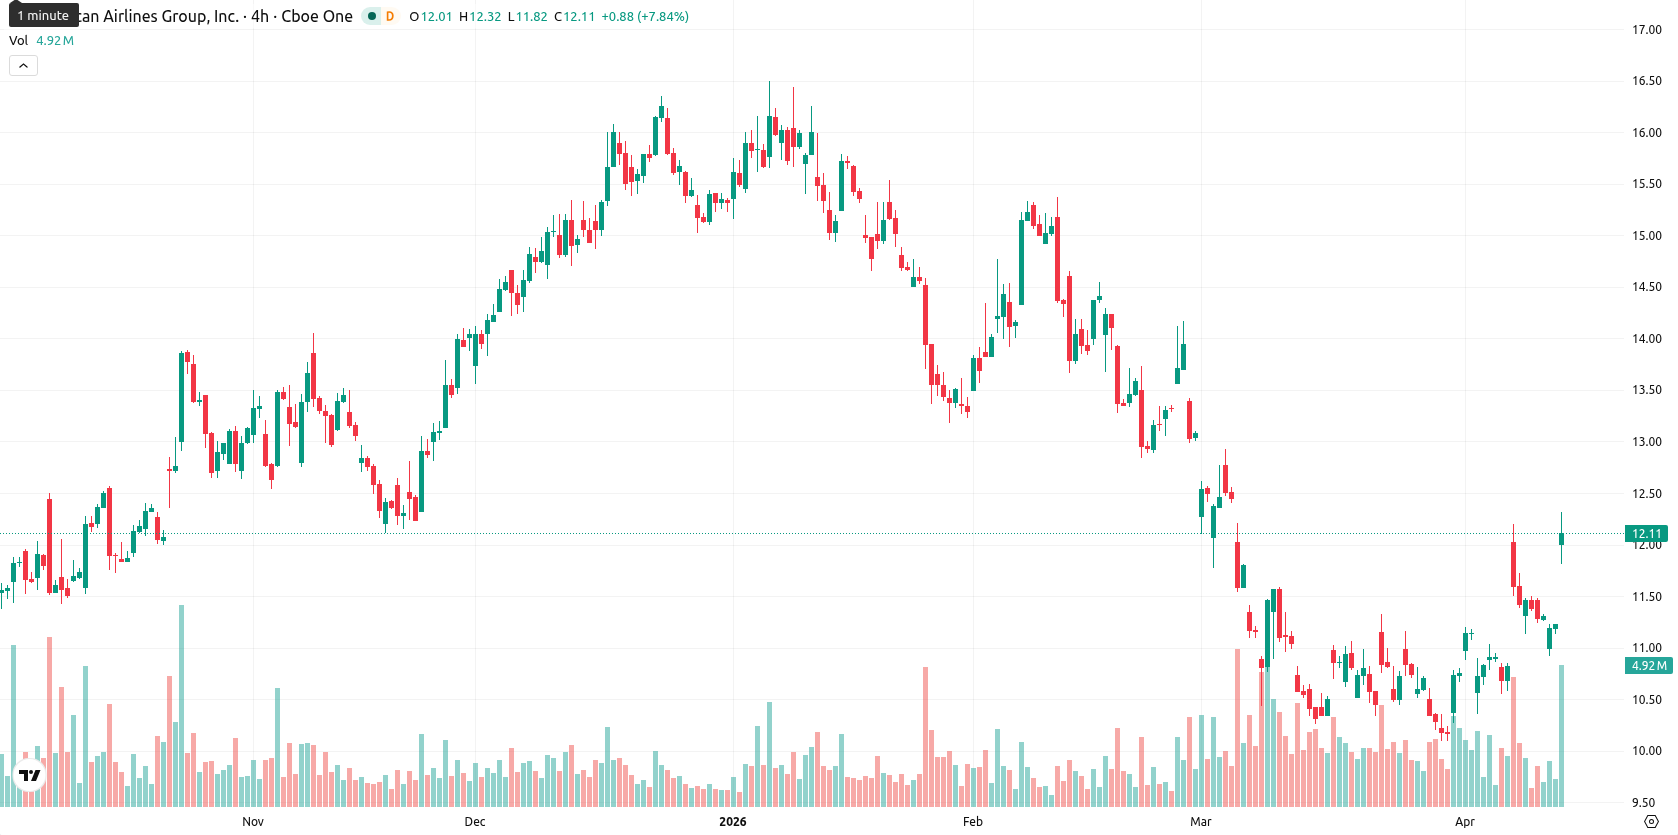
American Airlines Group (AAL) is trading at $12.13 after a sharp gain of 7.97% today. The asset is trading above the SMA-20 ($10.83) but remains below both the SMA-50 ($12.21) and SMA-200 ($12.91), highlighting positive short-term momentum while medium- and long-term trends are still constrained by overhead resistance.
Highlights
- American Airlines shares react to potential merger talks with United Airlines, signaling the possibility of historic industry consolidation.
- American Airlines is upgrading Dallas Fort Worth International Airport with electronic boarding gates to improve passenger processing.
- AAL faces resistance near 12.30, with mixed momentum indicators suggesting likely sideways or downward movement in the 11.75 to 12.30 range.
Merger speculation and innovation drive investor sentiment shifts
Shares of American Airlines are responding to reports of merger discussions with United Airlines after United's CEO Scott Kirby presented the idea to President Trump in late February. This potential merger, if successful, would represent the largest industry consolidation in over a decade, combining two of the biggest network carriers. Separately, American Airlines is implementing electronic boarding gates at Dallas Fort Worth International Airport to improve passenger flow.
Momentum mixed as near-term support holds amid overbought signals
Technically, AAL remains above the short-term SMA-20 but is just under the SMA-50 and beneath the SMA-200, suggesting that while near-term momentum is supportive, longer-term resistance levels still dominate. The Ichimoku Kijun (D1) at $11.15 provides immediate support. Momentum indicators are mixed: the D1 ADX is weak and shows a sell signal, while the MACD on D1 indicates strong selling pressure, in contrast to intraday timeframes showing some buying. The RSI reads neutral at 48.77, but both Stoch RSI and CCI are overbought, signaling possible exhaustion. BBP remains positive intraday, highlighting buyer dominance, and the session's broad trading range reflects ongoing high volatility with buying pressure after the gap up, though short-term swings are possible due to these mixed oscillator signals.
Sideways or lower bias expected as volatility persists and upside fades
Over the next 5 trading days, AAL is expected to fluctuate within a typical volatility band of $11.75 to $12.30. The probability of a further advance is low (less than 20%), suggesting sideways or downside bias is more likely. The baseline scenario is for rangebound action between $11.75 and $12.30 as buying enthusiasm moderates. A bullish breakout above $12.30 could drive further gains toward medium-term resistance, but would likely face substantial headwinds, while a sustained move below $11.75 could trigger fresh selling and a test of lower support levels, in line with longer-term technical signals.
Earlier, analysts noted that American Airlines shares were under broad bearish momentum despite short-term buyer interest. The current technical picture still cautions against chasing the rally, as upside potential remains limited by key resistance levels unless a decisive breakout above $12.30 materializes.


Latest American Airlines News


-
 Afghanistan
-
 Albania
-
 Algeria
-
 Angola
-
 Argentina
-
 Armenia
-
 Australia
-
 Austria
-
 Azerbaijan
-
 Bahamas
-
 Bahrain
-
 Bangladesh
-
 Belarus
-
 Belgium
-
 Bolivia
-
 Botswana
-
 Brazil
-
 Brunei
-
 Bulgaria
-
 Cambodia
-
 Cameroon
-
 Canada
-
 Chile
Chile
-
 China
China
-
 Colombia
-
 Congo
Congo
-
 Costa Rica
-
 Cote d'Ivoire
-
 Croatia
-
 Cuba
Cuba
-
 Cyprus
-
 Czechia
-
 DR Congo
-
 Denmark
-
 Dominican Republic
-
 Ecuador
-
 Egypt
Egypt
-
 El Salvador
-
 Estonia
-
 Eswatini
-
 Ethiopia
-
 Finland
-
 France
-
 Georgia
-
 Germany
-
 Ghana
Ghana
-
 Greece
-
 Haiti
Haiti
-
 Hong Kong
-
 Hungary
-
 India
India
-
 Indonesia
-
 Iran, Islamic republic
-
 Iraq
Iraq
-
 Ireland
-
 Israel
-
 Italy
Italy
-
 Jamaica
-
 Japan
Japan
-
 Jordan
-
 Kazakhstan
-
 Kenya
Kenya
-
 Korea
Korea
-
 Kuwait
-
 Kyrgyzstan
-
 Laos
Laos
-
 Latvia
-
 Lebanon
-
 Lesotho
-
 Libya
Libya
-
 Lithuania
-
 Luxembourg
-
 Madagascar
-
 Malaysia
-
 Malta
Malta
-
 Mauritius
-
 Mexico
-
 Moldova
-
 Mongolia
-
 Montenegro
-
 Morocco
-
 Mozambique
-
 Myanmar
-
 Namibia
-
 Nepal
Nepal
-
 Netherlands
-
 New Zealand
-
 Nigeria
-
 North Macedonia
-
 Norway
-
 Oman
Oman
-
 Pakistan
-
 Palestine
-
 Panama
-
 Papua New Guinea
-
 Paraguay
-
 Peru
Peru
-
 Philippines
-
 Poland
-
 Portugal
-
 Puerto Rico
-
 Qatar
Qatar
-
 Reunion
-
 Romania
-
 Rwanda
-
 Saudi Arabia
-
 Serbia
-
 Singapore
-
 Slovakia
-
 Slovenia
-
 Somalia
-
 South Africa
-
 Spain
Spain
-
 Sri Lanka
-
 Sweden
-
 Switzerland
-
 Syria
Syria
-
 Taiwan
-
 Tajikistan
-
 Tanzania
-
 Thailand
-
 Trinidad and Tobago
-
 Tunisia
-
 Turkey
-
 UAE
UAE
-
 Uganda
-
 Ukraine
-
 United Kingdom
-
United States
-
 Uruguay
-
 Uzbekistan
-
 Venezuela
-
 Vietnam
-
 Yemen
Yemen
-
 Zambia
-
 Zimbabwe
- Forex
- Crypto
