
Tesla stock price forecast: $370.33 support in focus as TSLA falls 6.54%

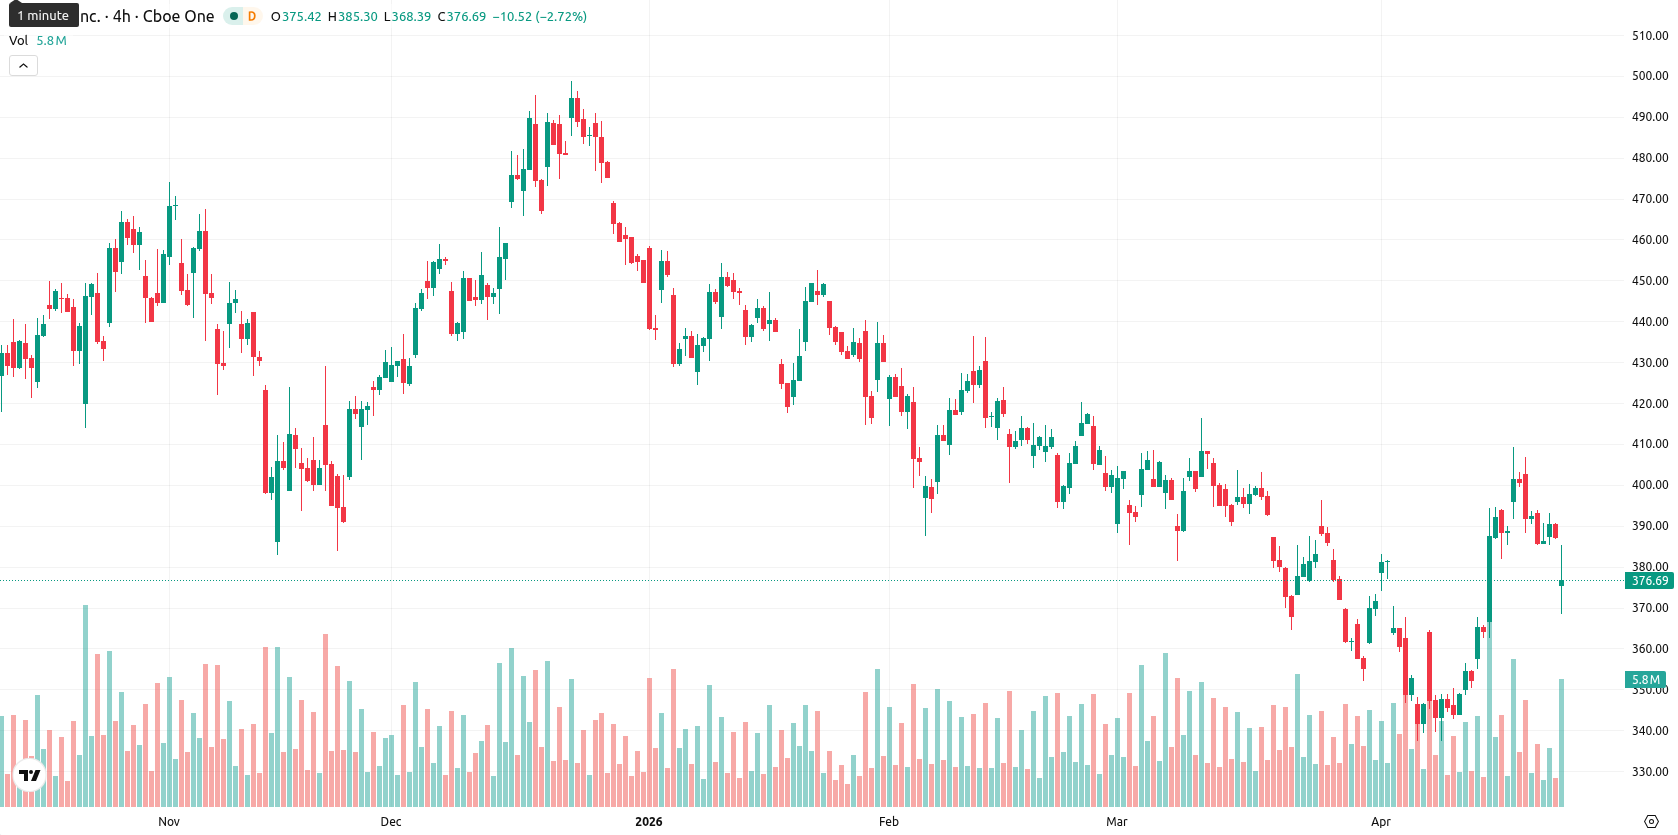
Tesla, Inc. (TSLA) is trading at $376.79, down 6.54% on the day. The price remains above its key short-term moving averages but below medium- and long-term averages.
Highlights
- Tesla recognized one-time benefits from U.S. Supreme Court tariff refund ruling, but ongoing China-sourced battery costs keep segment expenses elevated.
- Management is increasing capital expenditures to secure critical materials amid heightened geopolitical risk, trade uncertainty, and supply chain disruptions.
- Tesla faces near-term price consolidation between $368 and $384 as overbought technical signals, volatility, and selling pressure increase downside risk.
Tariff refund windfall offsets cost pressure as geopolitical risks intensify
On February 20, the U.S. Supreme Court struck down IEEPA tariffs, entitling importers to an estimated $175 billion in refunds, with U.S. Customs launching its refund portal on April 20. Tesla has recognized one-time benefits from tariff refunds and reported that tariffs continue to contribute to automotive and energy segment costs because of its dependence on battery cells sourced from China, with the lasting effects dependent on future policy developments. Management cited heightened geopolitical tensions and trade uncertainty as factors increasing capital expenditures to secure key materials and components across multiple regions. Brent crude futures have moved above $101 following Iranian attacks on ships and ongoing U.S. blockade activity, raising global supply chain risks for manufacturers reliant on cross-border logistics, though price action has remained under broader selling pressure.
Intraday volatility escalates as overbought signals clash with neutral momentum
TSLA is currently positioned above the SMA-20 at $370.33, but below the SMA-50 ($389.46) and SMA-200 ($400.15). The Ichimoku Kijun level on the D1 timeframe is set at $373.16, creating near-term support, while immediate resistance is seen at the SMA-50 level. Technical indicators highlight mixed momentum: ADX stands at 20.60, indicating a modest trend, and the MACD is neutral on the daily timeframe but bears a negative bias on the weekly chart. The RSI reads 59.56, placing it in a neutral-bullish zone, while CCI at 114.07 and Stoch RSI at 97.35 reflect overbought conditions, aligning with overbought signals from Bull/Bear Power (BBP). The daily chart displays heightened volatility, as TSLA quickly dropped to intraday lows near $368.57 following a significant gap down, with the Awesome Oscillator supporting the prior trend but highlighting a divergence as downside pressure persists.
Limited upside as price consolidation and downside risk dominate
For the coming five sessions, the expected volatility band for TSLA stands at $368–$384 based on recent price action. The probability of a price increase remains low (less than 20%), with a base case of consolidating between these levels. If price action rises above $384, this could trigger a bullish scenario, while a bearish scenario may develop if TSLA breaks below $368, opening the way for further downside movement.
Earlier, analysts noted that Tesla shares were consolidating within a defined range amid macroeconomic uncertainty, regulatory risks, and mixed technical signals. The latest developments surrounding tariff refunds and escalating geopolitical tensions add new layers to the risk environment, making it crucial for traders to monitor how TSLA responds to heightened supply chain pressures and shifting volatility dynamics in the upcoming sessions.


-
 Afghanistan
-
 Albania
-
 Algeria
-
 Angola
-
 Argentina
-
 Armenia
-
 Australia
-
 Austria
-
 Azerbaijan
-
 Bahamas
-
 Bahrain
-
 Bangladesh
-
 Belarus
-
 Belgium
-
 Bolivia
-
 Botswana
-
 Brazil
-
 Brunei
-
 Bulgaria
-
 Cambodia
-
 Cameroon
-
 Canada
-
 Chile
Chile
-
 China
China
-
 Colombia
-
 Congo
Congo
-
 Costa Rica
-
 Cote d'Ivoire
-
 Croatia
-
 Cuba
Cuba
-
 Cyprus
-
 Czechia
-
 DR Congo
-
 Denmark
-
 Dominican Republic
-
 Ecuador
-
 Egypt
Egypt
-
 El Salvador
-
 Estonia
-
 Eswatini
-
 Ethiopia
-
 Finland
-
 France
-
 Georgia
-
 Germany
-
 Ghana
Ghana
-
 Greece
-
 Haiti
Haiti
-
 Hong Kong
-
 Hungary
-
 India
India
-
 Indonesia
-
 Iran, Islamic republic
-
 Iraq
Iraq
-
 Ireland
-
 Israel
-
 Italy
Italy
-
 Jamaica
-
 Japan
Japan
-
 Jordan
-
 Kazakhstan
-
 Kenya
Kenya
-
 Korea
Korea
-
 Kuwait
-
 Kyrgyzstan
-
 Laos
Laos
-
 Latvia
-
 Lebanon
-
 Lesotho
-
 Libya
Libya
-
 Lithuania
-
 Luxembourg
-
 Madagascar
-
 Malaysia
-
 Malta
Malta
-
 Mauritius
-
 Mexico
-
 Moldova
-
 Mongolia
-
 Montenegro
-
 Morocco
-
 Mozambique
-
 Myanmar
-
 Namibia
-
 Nepal
Nepal
-
 Netherlands
-
 New Zealand
-
 Nigeria
-
 North Macedonia
-
 Norway
-
 Oman
Oman
-
 Pakistan
-
 Palestine
-
 Panama
-
 Papua New Guinea
-
 Paraguay
-
 Peru
Peru
-
 Philippines
-
 Poland
-
 Portugal
-
 Puerto Rico
-
 Qatar
Qatar
-
 Reunion
-
 Romania
-
 Rwanda
-
 Saudi Arabia
-
 Serbia
-
 Singapore
-
 Slovakia
-
 Slovenia
-
 Somalia
-
 South Africa
-
 Spain
Spain
-
 Sri Lanka
-
 Sweden
-
 Switzerland
-
 Syria
Syria
-
 Taiwan
-
 Tajikistan
-
 Tanzania
-
 Thailand
-
 Trinidad and Tobago
-
 Tunisia
-
 Turkey
-
 UAE
UAE
-
 Uganda
-
 Ukraine
-
 United Kingdom
-
United States
-
 Uruguay
-
 Uzbekistan
-
 Venezuela
-
 Vietnam
-
 Yemen
Yemen
-
 Zambia
-
 Zimbabwe
- Forex
- Crypto
