
Tesla stock consolidates as $250 million tariff refund boosts profits

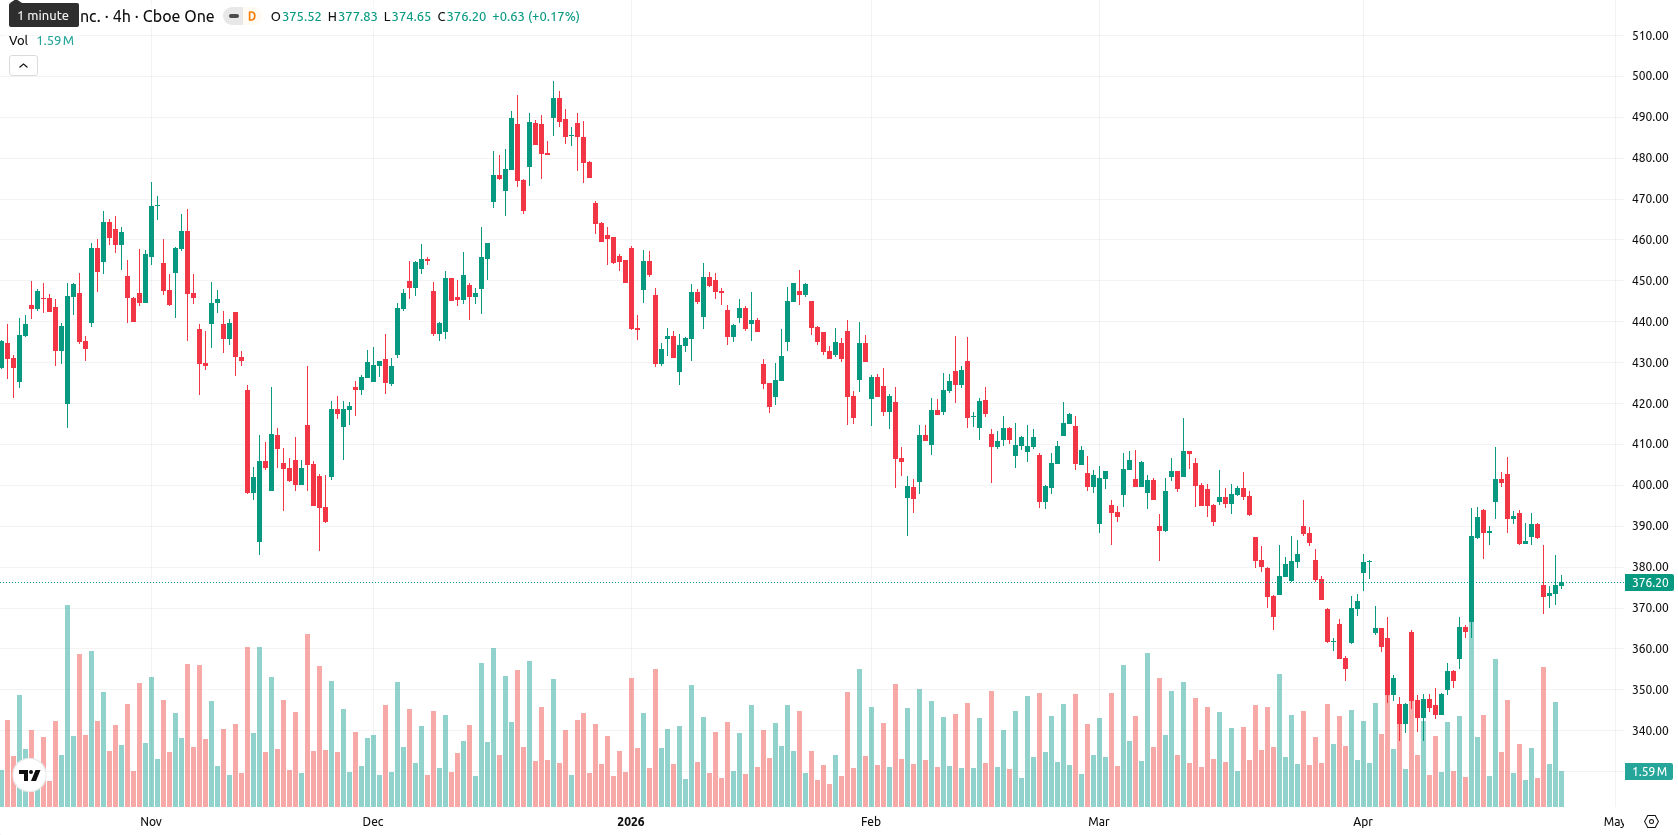
Tesla, Inc. (TSLA) is trading at $375.81, up 0.56% on the day. The price sits above its key short-term moving averages but remains below levels watched by longer-term traders.
Highlights
- Tesla faces increased supply chain risk as geopolitical tensions threaten semiconductor and lithium access, impacting future capital expenditures.
- Tesla's Q1 2026 profitability received a $250 million boost from refunded tariffs, underscoring reliance on international trade policy outcomes.
- Technicals reveal TSLA is trading in a narrow $362.00–$382.00 range with short-term intraday buyer activity but weak medium- and long-term trend signals.
Supply chain threats and tariff refund reshape profitability amid geopolitical strains
Tesla faces heightened supply chain risk due to geopolitical tensions impacting the availability of semiconductor chips and lithium, which has put its capital expenditure plans at risk of disruption. In the first quarter of 2026, Tesla reported a $250 million refund on previously paid tariffs, directly tying its recent profitability to international trade policy outcomes. Physical and operational security concerns have also risen as incidents of vandalism against Tesla and its CEO increase, linked to the company's government engagements.
Resistance holds as buyer interest offsets neutral momentum and weak RSI
TSLA’s price action presents several notable technical features: it closed above the SMA-20 at $369.12 and the Ichimoku Kijun (D1) at $373.16, which now forms immediate support. However, it stayed below both the SMA-50 at $387.07 and SMA-200 at $400.85, highlighting upper resistance levels. Daily MACD and ADX are neutral, while the RSI at 48.70 delivers a 'Sell' signal; Stoch RSI and CCI are neutral as well. The Bull/Bear Power (BBP) is strongly positive at 1.79, reflecting intraday buyer activity against an overall indecisive momentum backdrop, with price near its session mid-range after a moderate opening gap.
Sideways trading outlook as trend indicators favor downside risk
Over the next five trading days, TSLA is expected to remain in a typical volatility band between $362.00 and $382.00, staying close to its current level. The likelihood of further upside movement is low (less than 20%), given that the majority of daily and weekly trend and momentum indicators signal downside risk. The baseline scenario is for TSLA to trade sideways within this corridor. A move above resistance at the SMA-50 ($387.07) would open a bullish path, while a break below the Ichimoku Kijun ($373.16) or $362.00 would favor the bearish scenario.
Earlier, analysts noted that Tesla was consolidating as mixed technical factors and increased investment in future mobility services generated a cautious outlook. The present analysis adds new risk dimensions from supply chain and security threats, suggesting that traders should monitor the $362–$382 band for potential volatility and act swiftly if price breaks beyond these boundaries.


Latest Tesla News


-
 Afghanistan
-
 Albania
-
 Algeria
-
 Angola
-
 Argentina
-
 Armenia
-
 Australia
-
 Austria
-
 Azerbaijan
-
 Bahamas
-
 Bahrain
-
 Bangladesh
-
 Belarus
-
 Belgium
-
 Bolivia
-
 Botswana
-
 Brazil
-
 Brunei
-
 Bulgaria
-
 Cambodia
-
 Cameroon
-
 Canada
-
 Chile
Chile
-
 China
China
-
 Colombia
-
 Congo
Congo
-
 Costa Rica
-
 Cote d'Ivoire
-
 Croatia
-
 Cuba
Cuba
-
 Cyprus
-
 Czechia
-
 DR Congo
-
 Denmark
-
 Dominican Republic
-
 Ecuador
-
 Egypt
Egypt
-
 El Salvador
-
 Estonia
-
 Eswatini
-
 Ethiopia
-
 Finland
-
 France
-
 Georgia
-
 Germany
-
 Ghana
Ghana
-
 Greece
-
 Haiti
Haiti
-
 Hong Kong
-
 Hungary
-
 India
India
-
 Indonesia
-
 Iran, Islamic republic
-
 Iraq
Iraq
-
 Ireland
-
 Israel
-
 Italy
Italy
-
 Jamaica
-
 Japan
Japan
-
 Jordan
-
 Kazakhstan
-
 Kenya
Kenya
-
 Korea
Korea
-
 Kuwait
-
 Kyrgyzstan
-
 Laos
Laos
-
 Latvia
-
 Lebanon
-
 Lesotho
-
 Libya
Libya
-
 Lithuania
-
 Luxembourg
-
 Madagascar
-
 Malaysia
-
 Malta
Malta
-
 Mauritius
-
 Mexico
-
 Moldova
-
 Mongolia
-
 Montenegro
-
 Morocco
-
 Mozambique
-
 Myanmar
-
 Namibia
-
 Nepal
Nepal
-
 Netherlands
-
 New Zealand
-
 Nigeria
-
 North Macedonia
-
 Norway
-
 Oman
Oman
-
 Pakistan
-
 Palestine
-
 Panama
-
 Papua New Guinea
-
 Paraguay
-
 Peru
Peru
-
 Philippines
-
 Poland
-
 Portugal
-
 Puerto Rico
-
 Qatar
Qatar
-
 Reunion
-
 Romania
-
 Rwanda
-
 Saudi Arabia
-
 Serbia
-
 Singapore
-
 Slovakia
-
 Slovenia
-
 Somalia
-
 South Africa
-
 Spain
Spain
-
 Sri Lanka
-
 Sweden
-
 Switzerland
-
 Syria
Syria
-
 Taiwan
-
 Tajikistan
-
 Tanzania
-
 Thailand
-
 Trinidad and Tobago
-
 Tunisia
-
 Turkey
-
 UAE
UAE
-
 Uganda
-
 Ukraine
-
 United Kingdom
-
United States
-
 Uruguay
-
 Uzbekistan
-
 Venezuela
-
 Vietnam
-
 Yemen
Yemen
-
 Zambia
-
 Zimbabwe
- Forex
- Crypto
