
-2.34% for Nvidia stock as U.S. export controls tighten AI chip supply

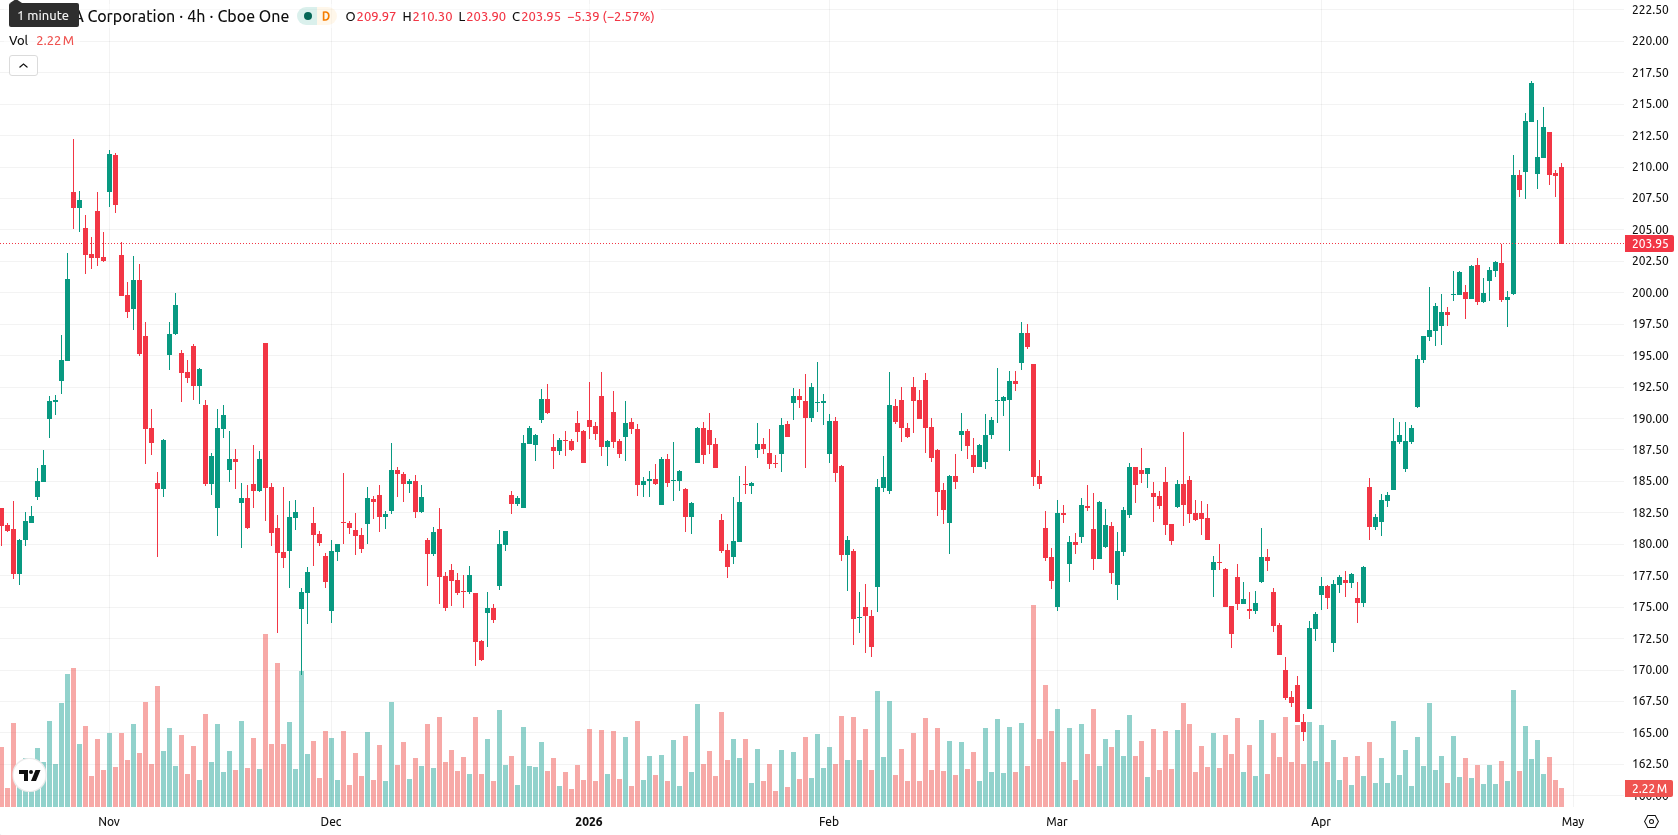
NVIDIA Corporation (NVDA) is trading at $203.65 after a daily decline of 2.34%. The price remains above its key moving averages, reflecting an ongoing bullish structure despite a notable pullback.
Highlights
- Nvidia B300 AI server prices have surged to nearly $1 million each in China as U.S. export restrictions tighten supply and elevate demand.
- Introduction of the Nemotron 3 Nano Omni AI model expands Nvidia’s reach in local and cloud AI markets despite recent price weakness.
- Technicals signal strong bullish structure with support at $190.55, expected to consolidate in the $194.00–$208.00 range over the next week.
Record server prices in China as export controls tighten supply
Nvidia B300 AI servers have reportedly reached prices near $1 million each in China following the impact of ongoing U.S. export controls, signaling persistent supply constraints and heightened demand in regulated markets. The company has scheduled a call on May 20, 2026, to review first-quarter fiscal 2027 financial results, setting the stage for further fundamental updates. Recent disclosure of the Nemotron 3 Nano Omni AI model also broadens Nvidia's presence across local hardware and cloud AI workloads, though price action has remained under broader selling pressure.
Strong daily momentum meets weak trend strength on mixed signals
The price is currently above the SMA-20 at $194.92, the SMA-50 at $186.69, and the SMA-200 at $183.57. Ichimoku’s Kijun level at $190.55 acts as immediate support. On the daily chart, MACD is in Buy territory, but ADX is weak at 18.22, indicating limited trend momentum. RSI stands at 64.48, while CCI registers 93.82 and Stoch RSI is at 20.85, all pointing to a market that is neither overbought nor deeply oversold. Bull/Bear Power remains in strong buyer territory on the daily timeframe; however, short-term intraday readings (5–60 minute intervals) show the asset is currently oversold, reflecting a recent swing in sentiment despite the daily bullish momentum. The Awesome Oscillator is also trending upward on the daily chart.
Bullish potential builds as consolidation holds above support
Over the next five trading days, NVDA is expected to trade within a typical volatility band of $194.00 to $208.00, encircling current levels. There is a high likelihood (over 80%) of further price increases, supported by strong weekly RSI, MACD, and MA-50 readings. The baseline scenario is sideways consolidation, with support at $190.55 and resistance near $208.00. A clear breakout above $208.00 would open bullish potential, while a drop below $190.55 would signal a transition to a bearish scenario.
Earlier, analysts noted that Nvidia sustained a bullish technical structure amid heightened geopolitical and supply chain risks, while cautioning that momentum could weaken if external pressures intensified. The latest price action and demand signals now reinforce this scenario, making the upcoming test of the $208 resistance a pivotal indicator for whether bullish momentum can extend or transitions to sideways consolidation.


Latest NVDA News


-
 Afghanistan
-
 Albania
-
 Algeria
-
 Angola
-
 Argentina
-
 Armenia
-
 Australia
-
 Austria
-
 Azerbaijan
-
 Bahamas
-
 Bahrain
-
 Bangladesh
-
 Belarus
-
 Belgium
-
 Bolivia
-
 Botswana
-
 Brazil
-
 Brunei
-
 Bulgaria
-
 Cambodia
-
 Cameroon
-
 Canada
-
 Chile
Chile
-
 China
China
-
 Colombia
-
 Congo
Congo
-
 Costa Rica
-
 Cote d'Ivoire
-
 Croatia
-
 Cuba
Cuba
-
 Cyprus
-
 Czechia
-
 DR Congo
-
 Denmark
-
 Dominican Republic
-
 Ecuador
-
 Egypt
Egypt
-
 El Salvador
-
 Estonia
-
 Eswatini
-
 Ethiopia
-
 Finland
-
 France
-
 Georgia
-
 Germany
-
 Ghana
Ghana
-
 Greece
-
 Haiti
Haiti
-
 Hong Kong
-
 Hungary
-
 India
India
-
 Indonesia
-
 Iran, Islamic republic
-
 Iraq
Iraq
-
 Ireland
-
 Israel
-
 Italy
Italy
-
 Jamaica
-
 Japan
Japan
-
 Jordan
-
 Kazakhstan
-
 Kenya
Kenya
-
 Korea
Korea
-
 Kuwait
-
 Kyrgyzstan
-
 Laos
Laos
-
 Latvia
-
 Lebanon
-
 Lesotho
-
 Libya
Libya
-
 Lithuania
-
 Luxembourg
-
 Madagascar
-
 Malaysia
-
 Malta
Malta
-
 Mauritius
-
 Mexico
-
 Moldova
-
 Mongolia
-
 Montenegro
-
 Morocco
-
 Mozambique
-
 Myanmar
-
 Namibia
-
 Nepal
Nepal
-
 Netherlands
-
 New Zealand
-
 Nigeria
-
 North Macedonia
-
 Norway
-
 Oman
Oman
-
 Pakistan
-
 Palestine
-
 Panama
-
 Papua New Guinea
-
 Paraguay
-
 Peru
Peru
-
 Philippines
-
 Poland
-
 Portugal
-
 Puerto Rico
-
 Qatar
Qatar
-
 Reunion
-
 Romania
-
 Rwanda
-
 Saudi Arabia
-
 Serbia
-
 Singapore
-
 Slovakia
-
 Slovenia
-
 Somalia
-
 South Africa
-
 Spain
Spain
-
 Sri Lanka
-
 Sweden
-
 Switzerland
-
 Syria
Syria
-
 Taiwan
-
 Tajikistan
-
 Tanzania
-
 Thailand
-
 Trinidad and Tobago
-
 Tunisia
-
 Turkey
-
 UAE
UAE
-
 Uganda
-
 Ukraine
-
 United Kingdom
-
United States
-
 Uruguay
-
 Uzbekistan
-
 Venezuela
-
 Vietnam
-
 Yemen
Yemen
-
 Zambia
-
 Zimbabwe
- Forex
- Crypto
