

AMD stock price forecast: $345.00 support as AMD trades flat

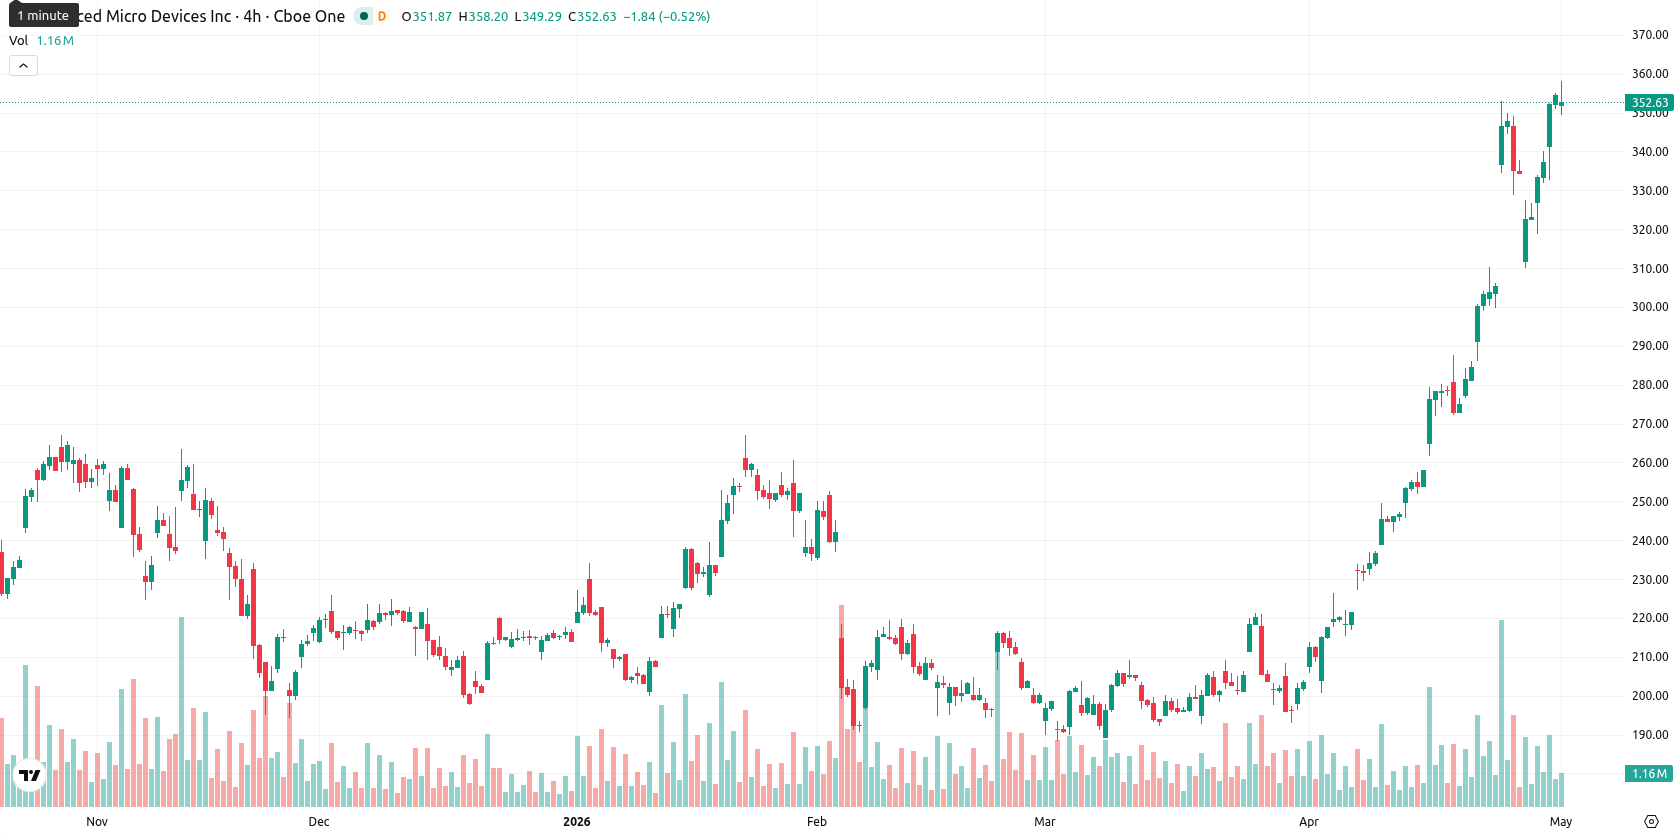
Advanced Micro Devices (AMD) is trading at $351.44, down 0.39% for the day. The stock remains well above its key moving averages, reflecting its strong position across short-, medium-, and long-term trendlines.
 598.35
658.44
598.35
658.44
Highlights
- AMD maintains a strong bullish trend across short-, medium-, and long-term timeframes, trading well above key moving averages.
- Momentum indicators confirm continued bullishness, but overbought signals suggest elevated risk of a short-term pullback.
- Expected price action for the next five sessions is a consolidation between $345.00 and $360.00, with $345.00 as key support and $360.00 as resistance.
Overbought signals diverge from intraday weakness as momentum persists
On the technical side, AMD is trading above the SMA-20 at $277.68, SMA-50 at $232.21, and SMA-200 at $210.37. The Ichimoku Kijun level, now at $273.90, provides immediate support beneath the current price. Momentum indicators on the daily chart show continued strength: MACD and ADX maintain bullish momentum, with the Awesome Oscillator also aligning positively. RSI is elevated at 78.50 and CCI registers 129.03, both indicating overbought conditions; Stoch RSI is neutral, and Bull/Bear Power (BBP) reflects persistent buyer dominance on an intraday basis. However, price action shows AMD experienced a small gap up at the open ($352.82 to $355.48) and is trading near today's session lows, exhibiting moderate volatility and pressure after the open. This suggests a divergence between strong underlying momentum and short-term intraday weakness.
Sideways scenario favored as bullish indicators outpace volatility risk
In the short term, the anticipated trading range for AMD over the next five sessions is expected to fall between $345.00 and $360.00, reflecting a typical volatility band relative to current levels. The baseline scenario projects sideways price movement within this range. A decisive move above $360.00 would establish a bullish scenario, while a breakdown below $345.00 could signal a shift toward a bearish outcome. The probability of a price increase remains high, supported by bullish signals across the weekly RSI, ADX, MACD, and MA-50.
Earlier, analysts noted that AMD maintained strong bullish momentum supported by robust technicals, while advising some caution due to overbought conditions. The current setup reinforces this view with AMD sustaining elevated momentum despite intraday weakness, and traders should closely monitor for a potential breakout above $360.00 or a drop below $345.00 as directional catalysts.











-
 Afghanistan
-
 Albania
-
 Algeria
-
 Angola
-
 Argentina
-
 Armenia
-
 Australia
-
 Austria
-
 Azerbaijan
-
 Bahamas
-
 Bahrain
-
 Bangladesh
-
 Belarus
-
 Belgium
-
 Bolivia
-
 Botswana
-
 Brazil
-
 Brunei
-
 Bulgaria
-
 Cambodia
-
 Cameroon
-
 Canada
-
 Chile
Chile
-
 China
China
-
 Colombia
-
 Congo
Congo
-
 Costa Rica
-
 Cote d'Ivoire
-
 Croatia
-
 Cuba
Cuba
-
 Cyprus
-
 Czechia
-
 DR Congo
-
 Denmark
-
 Dominican Republic
-
 Ecuador
-
 Egypt
Egypt
-
 El Salvador
-
 Estonia
-
 Eswatini
-
 Ethiopia
-
 Finland
-
 France
-
 Georgia
-
 Germany
-
 Ghana
Ghana
-
 Greece
-
 Haiti
Haiti
-
 Hong Kong
-
 Hungary
-
 India
India
-
 Indonesia
-
 Iran, Islamic republic
-
 Iraq
Iraq
-
 Ireland
-
 Israel
-
 Italy
Italy
-
 Jamaica
-
 Japan
Japan
-
 Jordan
-
 Kazakhstan
-
 Kenya
Kenya
-
 Korea
Korea
-
 Kuwait
-
 Kyrgyzstan
-
 Laos
Laos
-
 Latvia
-
 Lebanon
-
 Lesotho
-
 Libya
Libya
-
 Lithuania
-
 Luxembourg
-
 Madagascar
-
 Malaysia
-
 Malta
Malta
-
 Mauritius
-
 Mexico
-
 Moldova
-
 Mongolia
-
 Montenegro
-
 Morocco
-
 Mozambique
-
 Myanmar
-
 Namibia
-
 Nepal
Nepal
-
 Netherlands
-
 New Zealand
-
 Nigeria
-
 North Macedonia
-
 Norway
-
 Oman
Oman
-
 Pakistan
-
 Palestine
-
 Panama
-
 Papua New Guinea
-
 Paraguay
-
 Peru
Peru
-
 Philippines
-
 Poland
-
 Portugal
-
 Puerto Rico
-
 Qatar
Qatar
-
 Reunion
-
 Romania
-
 Rwanda
-
 Saudi Arabia
-
 Serbia
-
 Singapore
-
 Slovakia
-
 Slovenia
-
 Somalia
-
 South Africa
-
 Spain
Spain
-
 Sri Lanka
-
 Sweden
-
 Switzerland
-
 Syria
Syria
-
 Taiwan
-
 Tajikistan
-
 Tanzania
-
 Thailand
-
 Trinidad and Tobago
-
 Tunisia
-
 Turkey
-
 UAE
UAE
-
 Uganda
-
 Ukraine
-
 United Kingdom
-
United States
-
 Uruguay
-
 Uzbekistan
-
 Venezuela
-
 Vietnam
-
 Yemen
Yemen
-
 Zambia
-
 Zimbabwe
- Forex
- Crypto












