
META stock slides slightly as negative momentum persists near $625 resistance: weekly review

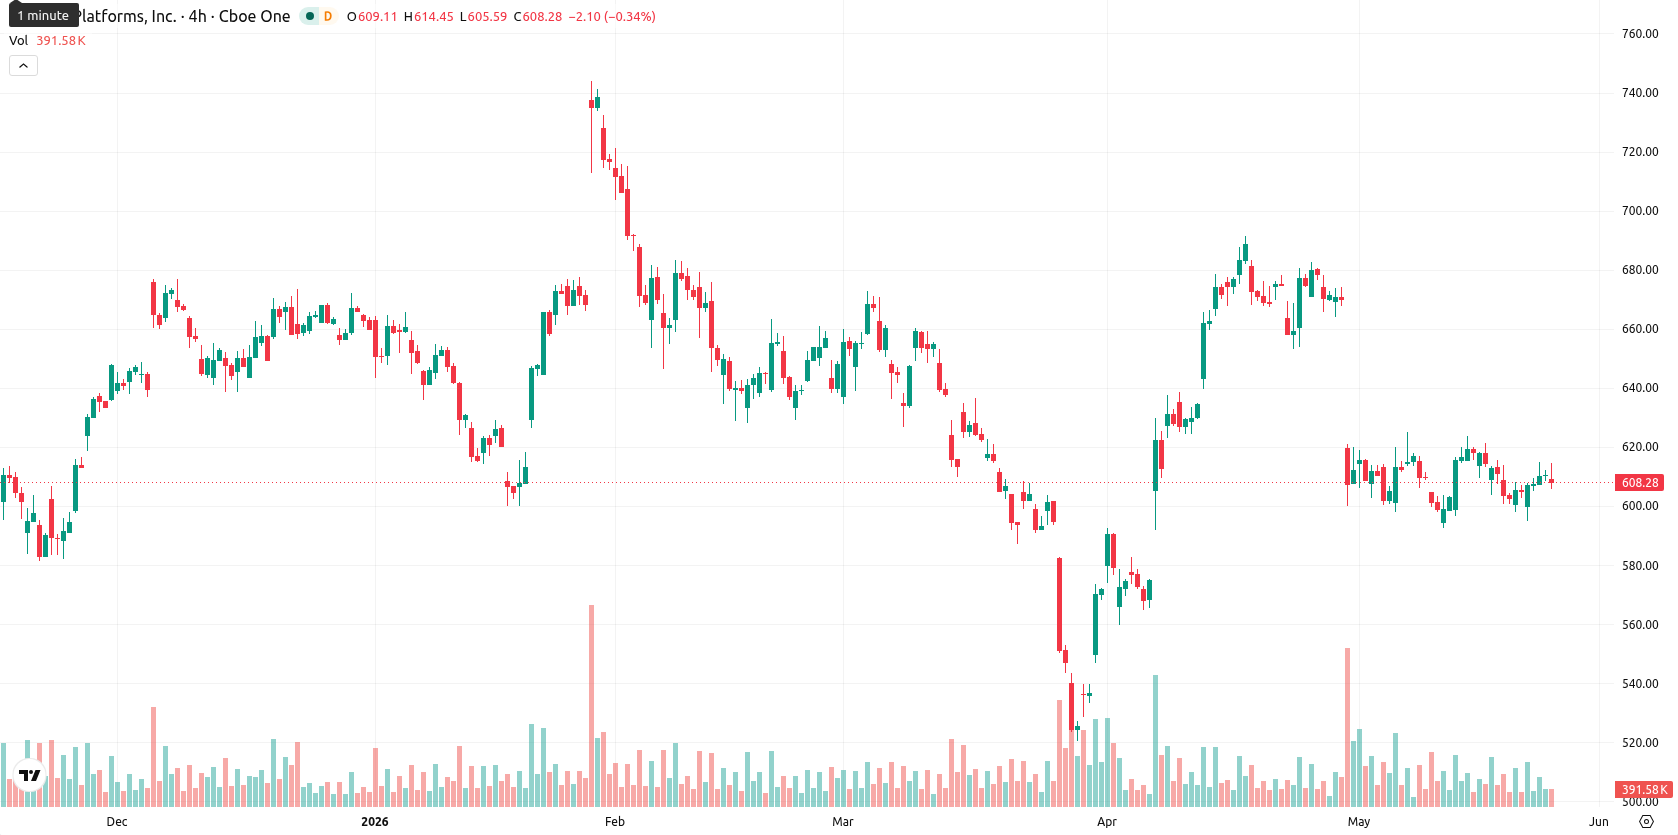
Meta Platforms, Inc. (META, formerly Facebook) is trading at $606.68 following a $2.93 drop (0.39%) over the past week, with the asset positioned below both its weekly MA-20 at $631.97 and MA-50 at $674.07, but maintaining a strong long-term trend by holding well above the MA-200 at $456.27. This reflects short-term selling pressure, although the longer-term structure remains constructive above the 200-week average.
Highlights
- Meta shares face medium-term selling pressure, trading below key weekly averages but maintaining a long-term uptrend above major support.
- Momentum and oscillators indicate pronounced bearishness, with MACD signaling strong sell and overall trend strength remaining weak.
- Price is forecast to move between $588 and $625 next week, with a sideways to bearish bias unless resistance at $625 is broken.
Investment shifts and AI spending drive sentiment this week
Meta raised its 2026 capital expenditure guidance to $125–145 billion to support AI infrastructure investments, marking a significant strategic move amid ongoing investment in future technologies. The company also implemented major workforce reductions in recent months, laying off approximately 8,000 employees, and reported a 33% rise in Q1 revenue. Institutional activity included reductions in holdings by Thrivent Financial for Lutherans and AMJ Financial Wealth Management, while Lockheed Martin Investment Management Co. notably increased its stake. Progress on ongoing litigation was marked by the US Supreme Court's decision to allow Vermont's social media addiction case against Meta to proceed.
Bearish weekly momentum as technicals confirm negative bias
On the weekly chart, META remains pressured as it trades below its MA-20 and MA-50, while continuing to show strong long-term support above the MA-200. Key weekly support is seen at $588, with resistance at $625. The RSI (W1) is at 46.15, indicating mild selling pressure, while other weekly oscillators such as the CCI and Stochastic RSI signal bearish to neutral momentum. The MACD remains on a strong sell, the ADX highlights a lack of clear trend strength, and Bull/Bear Power points to an oversold condition. The Awesome Oscillator is neutral, with brief counter-trend signals failing to outweigh predominant negative momentum.
Sideways to bearish outlook projected amid low breakout odds
For the upcoming five trading days, weekly indicators suggest a continuation of sideways to bearish price movement within a $588 to $625 range. A sustained move above $625 could open the way for short-term recovery, but the probability of such a breakout is low given the current technical setup. If price falls below $588, a deeper sell-off could unfold in line with the current negative momentum. The most likely scenario is for META to remain under medium-term pressure as sellers dominate, with low odds of a bullish reversal in the near term.
Earlier, analysts noted that Meta faced constrained upside momentum due to persistent technical resistance, heightened regulatory risk, and mixed institutional sentiment. The current technical setup reinforces this cautious outlook, with new signs of selling pressure and weak trend signals suggesting traders should closely monitor the $588 support zone for potential downside volatility.


-
 Afghanistan
-
 Albania
-
 Algeria
-
 Angola
-
 Argentina
-
 Armenia
-
 Australia
-
 Austria
-
 Azerbaijan
-
 Bahamas
-
 Bahrain
-
 Bangladesh
-
 Belarus
-
 Belgium
-
 Bolivia
-
 Botswana
-
 Brazil
-
 Brunei
-
 Bulgaria
-
 Cambodia
-
 Cameroon
-
 Canada
-
 Chile
Chile
-
 China
China
-
 Colombia
-
 Congo
Congo
-
 Costa Rica
-
 Cote d'Ivoire
-
 Croatia
-
 Cuba
Cuba
-
 Cyprus
-
 Czechia
-
 DR Congo
-
 Denmark
-
 Dominican Republic
-
 Ecuador
-
 Egypt
Egypt
-
 El Salvador
-
 Estonia
-
 Eswatini
-
 Ethiopia
-
 Finland
-
 France
-
 Georgia
-
 Germany
-
 Ghana
Ghana
-
 Greece
-
 Haiti
Haiti
-
 Hong Kong
-
 Hungary
-
 India
India
-
 Indonesia
-
 Iran, Islamic republic
-
 Iraq
Iraq
-
 Ireland
-
 Israel
-
 Italy
Italy
-
 Jamaica
-
 Japan
Japan
-
 Jordan
-
 Kazakhstan
-
 Kenya
Kenya
-
 Korea
Korea
-
 Kuwait
-
 Kyrgyzstan
-
 Laos
Laos
-
 Latvia
-
 Lebanon
-
 Lesotho
-
 Libya
Libya
-
 Lithuania
-
 Luxembourg
-
 Madagascar
-
 Malaysia
-
 Malta
Malta
-
 Mauritius
-
 Mexico
-
 Moldova
-
 Mongolia
-
 Montenegro
-
 Morocco
-
 Mozambique
-
 Myanmar
-
 Namibia
-
 Nepal
Nepal
-
 Netherlands
-
 New Zealand
-
 Nigeria
-
 North Macedonia
-
 Norway
-
 Oman
Oman
-
 Pakistan
-
 Palestine
-
 Panama
-
 Papua New Guinea
-
 Paraguay
-
 Peru
Peru
-
 Philippines
-
 Poland
-
 Portugal
-
 Puerto Rico
-
 Qatar
Qatar
-
 Reunion
-
 Romania
-
 Rwanda
-
 Saudi Arabia
-
 Serbia
-
 Singapore
-
 Slovakia
-
 Slovenia
-
 Somalia
-
 South Africa
-
 Spain
Spain
-
 Sri Lanka
-
 Sweden
-
 Switzerland
-
 Syria
Syria
-
 Taiwan
-
 Tajikistan
-
 Tanzania
-
 Thailand
-
 Trinidad and Tobago
-
 Tunisia
-
 Turkey
-
 UAE
UAE
-
 Uganda
-
 Ukraine
-
 United Kingdom
-
United States
-
 Uruguay
-
 Uzbekistan
-
 Venezuela
-
 Vietnam
-
 Yemen
Yemen
-
 Zambia
-
 Zimbabwe
- Forex
- Crypto
