
Nvidia stock price forecast: $199.36 support as NVDA trades sideways

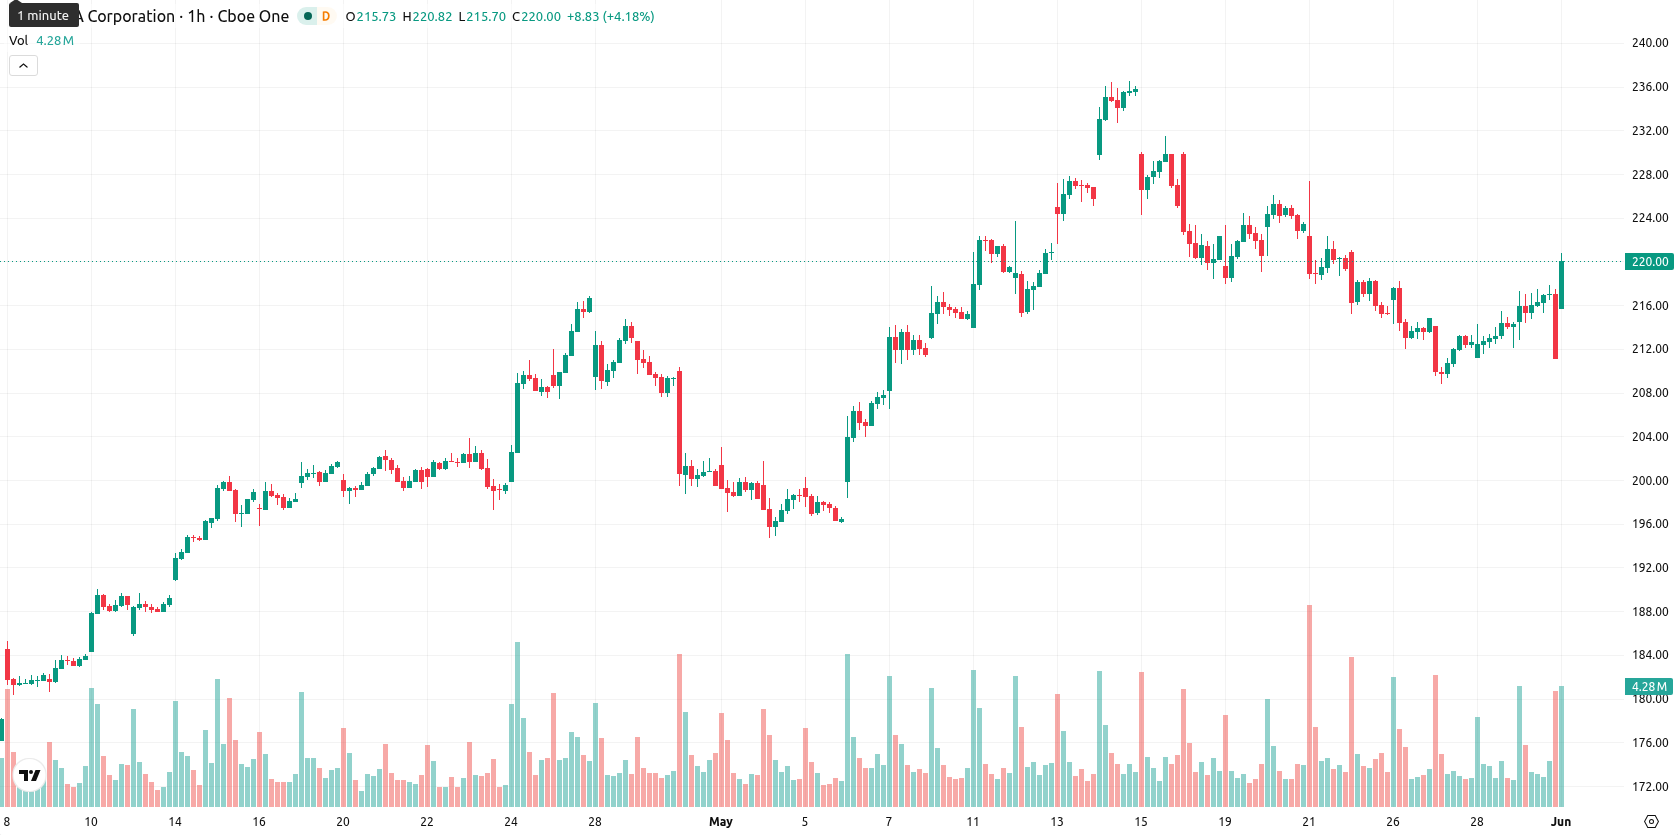
Nvidia (NVDA) stock is trading at $212.61 after a daily decline of 0.77%. The price sits below its key short-term moving averages but remains above medium- and long-term averages, reflecting persistent strength despite today's downside move.
Highlights
- Nvidia entered the PC processor market with its N1X and RTX Spark superchips, expanding competition beyond GPUs and into CPUs.
- The Vera Rubin platform's full-scale deployment and alliances with enterprise software providers signal Nvidia's aggressive infrastructure and ecosystem growth.
- NVDA shows short-term selling but retains a strong medium- and long-term uptrend, with expected consolidation between $209.90 and $213.60 barring a breakout above resistance.
Market expansion and alliances boost Nvidia amid selling pressure
Nvidia formally entered the PC processor market with the June 1 announcement of its N1X processor and RTX Spark superchip at GTC Taipei 2026, broadening its competitive landscape into the CPU segment. The co-development of the N1X processor with MediaTek using advanced 3-nanometer process technology and the industrial rollout of the Vera Rubin platform, now moving into full production for agentic AI factories, highlight Nvidia's push into new markets and infrastructure. The company further expanded its ecosystem by introducing new software, open-source models, and forming alliances with leading enterprise software providers, while shareholder returns were addressed through a raised dividend to $0.25 per share and an expanded buyback authorization. These developments follow the release of strong fiscal 2027 Q1 results and robust free cash flow, though price action has remained under broader selling pressure.
Mixed technical momentum as volatility rises near key resistance
Technically, NVDA faces immediate resistance at the Ichimoku Kijun level of $215.64, aligning with the SMA-20 at $215.49. Support lies at the SMA-50 at $199.36 and further below at the SMA-200 at $187.65. Momentum indicators show mixed signals: the MACD indicates strong buy, the ADX is neutral, the RSI is near 51 and signals a buy, while the Stoch RSI is oversold and the CCI remains neutral. BBP suggests overbought conditions and ongoing buyer dominance, but intraday volatility has increased, with the price moving closer to the lower end of today’s range after an initial gap up and subsequent selling.
Sideways trade expected as range persists and breakout risks mount
The short-term outlook expects NVDA to trade between $209.90 and $213.60, reflecting typical volatility near current levels. The baseline scenario is for the price to fluctuate sideways within this narrow band. A move above $215.64 could prompt renewed bullish momentum, while a break below $209.90 risks a deeper pullback toward the next support.
Previously it was reported that Nvidia entered the PC processor market with the introduction of its N1X chip and RTX Spark superchip, marking a significant expansion beyond its traditional GPU business. With the stock now exhibiting heightened volatility and consolidating above key medium- and long-term averages, traders should monitor the $215.64 resistance level closely as a potential catalyst for renewed bullish momentum should it be exceeded.


Latest NVDA News


-
 Afghanistan
-
 Albania
-
 Algeria
-
 Angola
-
 Argentina
-
 Armenia
-
 Australia
-
 Austria
-
 Azerbaijan
-
 Bahamas
-
 Bahrain
-
 Bangladesh
-
 Belarus
-
 Belgium
-
 Bolivia
-
 Botswana
-
 Brazil
-
 Brunei
-
 Bulgaria
-
 Cambodia
-
 Cameroon
-
 Canada
-
 Chile
Chile
-
 China
China
-
 Colombia
-
 Congo
Congo
-
 Costa Rica
-
 Cote d'Ivoire
-
 Croatia
-
 Cuba
Cuba
-
 Cyprus
-
 Czechia
-
 DR Congo
-
 Denmark
-
 Dominican Republic
-
 Ecuador
-
 Egypt
Egypt
-
 El Salvador
-
 Estonia
-
 Eswatini
-
 Ethiopia
-
 Finland
-
 France
-
 Georgia
-
 Germany
-
 Ghana
Ghana
-
 Greece
-
 Haiti
Haiti
-
 Hong Kong
-
 Hungary
-
 India
India
-
 Indonesia
-
 Iran, Islamic republic
-
 Iraq
Iraq
-
 Ireland
-
 Israel
-
 Italy
Italy
-
 Jamaica
-
 Japan
Japan
-
 Jordan
-
 Kazakhstan
-
 Kenya
Kenya
-
 Korea
Korea
-
 Kuwait
-
 Kyrgyzstan
-
 Laos
Laos
-
 Latvia
-
 Lebanon
-
 Lesotho
-
 Libya
Libya
-
 Lithuania
-
 Luxembourg
-
 Madagascar
-
 Malaysia
-
 Malta
Malta
-
 Mauritius
-
 Mexico
-
 Moldova
-
 Mongolia
-
 Montenegro
-
 Morocco
-
 Mozambique
-
 Myanmar
-
 Namibia
-
 Nepal
Nepal
-
 Netherlands
-
 New Zealand
-
 Nigeria
-
 North Macedonia
-
 Norway
-
 Oman
Oman
-
 Pakistan
-
 Palestine
-
 Panama
-
 Papua New Guinea
-
 Paraguay
-
 Peru
Peru
-
 Philippines
-
 Poland
-
 Portugal
-
 Puerto Rico
-
 Qatar
Qatar
-
 Reunion
-
 Romania
-
 Rwanda
-
 Saudi Arabia
-
 Serbia
-
 Singapore
-
 Slovakia
-
 Slovenia
-
 Somalia
-
 South Africa
-
 Spain
Spain
-
 Sri Lanka
-
 Sweden
-
 Switzerland
-
 Syria
Syria
-
 Taiwan
-
 Tajikistan
-
 Tanzania
-
 Thailand
-
 Trinidad and Tobago
-
 Tunisia
-
 Turkey
-
 UAE
UAE
-
 Uganda
-
 Ukraine
-
 United Kingdom
-
United States
-
 Uruguay
-
 Uzbekistan
-
 Venezuela
-
 Vietnam
-
 Yemen
Yemen
-
 Zambia
-
 Zimbabwe
- Forex
- Crypto
